 Linux监控之夜莺
[toc]
# 安装前置依赖
- mysql
- redis
# 二进制方式部署(推荐)
在网站现在最新安装包https://flashcat.cloud/download/nightingale/ (opens new window)
# 下载
wget https://download.flashcat.cloud/n9e-v6.3.1-linux-amd64.tar.gz

# 创建个 n9e 的目录,后面把 n9e 相关的文件解压到这里
mkdir -p /opt/n9e
mv n9e-v6.3.1-linux-amd64.tar.gz n9e
cd n9e

# 解压
tar -zxvf n9e-v6.3.1-linux-amd64.tar.gz

# 解压缩之后,可以看到 n9e.sql 是建表语句,导入数据库
mysql -uroot -p1234 < n9e.sql

# 启动 n9e,先使用 nohup 简单测试,如果需要 systemd 托管,请自行准备 service 文件
nohup ./n9e &> n9e.log &

# 检查 n9e.log 是否有异常日志,检查端口是否在监听,正常应该监听在 17000
ss -tlnp|grep 17000
2
3
4
5
6
7
8
9
10
11
12
13
14
15
16
17
18
19
如果日志和端口都没啥问题,恭喜,你完成了夜莺的安装!通过浏览器访问这个机器的 17000,理论上就可以看到登录页面了。
访问http://ip:17000

默认账号密码:root root.2020
# 夜莺日志位置
n9e/n9e.log
# 安装 VictoriaMetrics
VictoriaMetrics 下载地址在 github releases (opens new window) 上,作为技术人员,我想,你应该可以下载的到。我的环境是 x86_64 的 linux,所以选择下载:victoria-metrics-linux-amd64-v1.93.6.tar.gz (撰写这个文档的时候,最新版本是 v1.93.6)。
VictoriaMetrics 解压缩之后,里边就一个二进制:
mkdir victoria
cd victoria
wget https://github.com/VictoriaMetrics/VictoriaMetrics/releases/download/v1.93.6/victoria-metrics-linux-amd64-v1.93.6.tar.gz
tar -zxvf victoria-metrics-linux-amd64-v1.93.6.tar.gz
2
3
4
查看解压后文件
# ll
total 32476
-rw-r--r-- 1 root root 11579644 Oct 18 11:44 victoria-metrics-linux-amd64-v1.93.6.tar.gz
-rwxr-xr-x 1 1000 1000 21669672 Oct 17 05:45 victoria-metrics-prod
2
3
4
启动
nohup ./victoria-metrics-prod &> stdout.log &
查看端口8428
# ss -tlnp|grep 8428
LISTEN     0      32768        *:8428                     *:*                   users:(("victoria-metric",pid=726,fd=7))
2
访问接口http://ip:8428
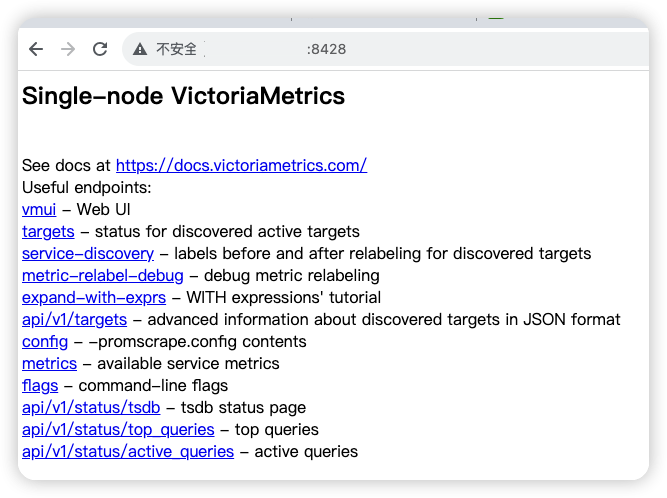
如上,就表示 VictoriaMetrics 安装成功,当然,我仅仅使用 nohup 简单启动的,如果生产环境,建议使用 systemd 托管并设置开机自启动。
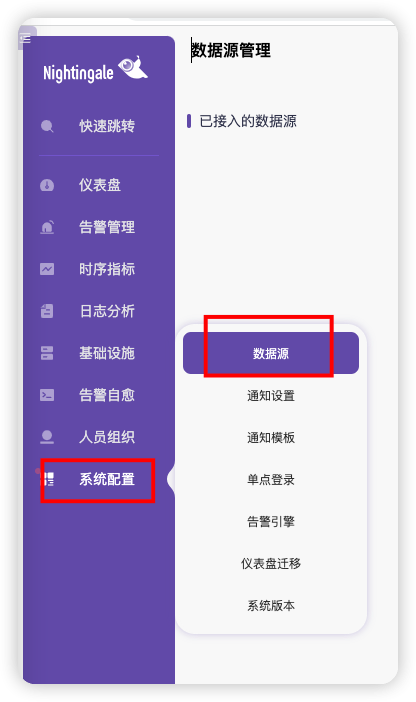
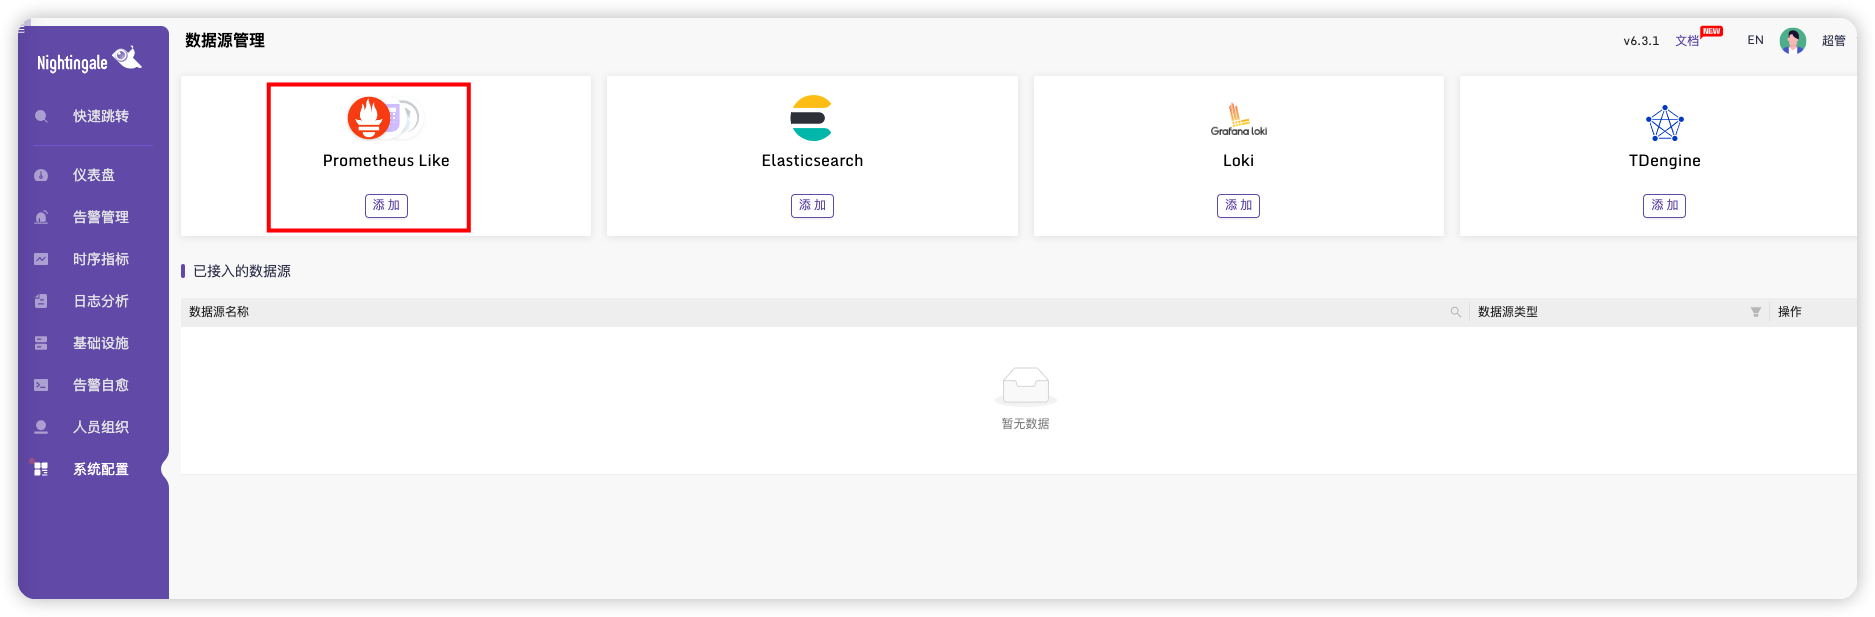
# 打通夜莺和 VictoriaMetrics
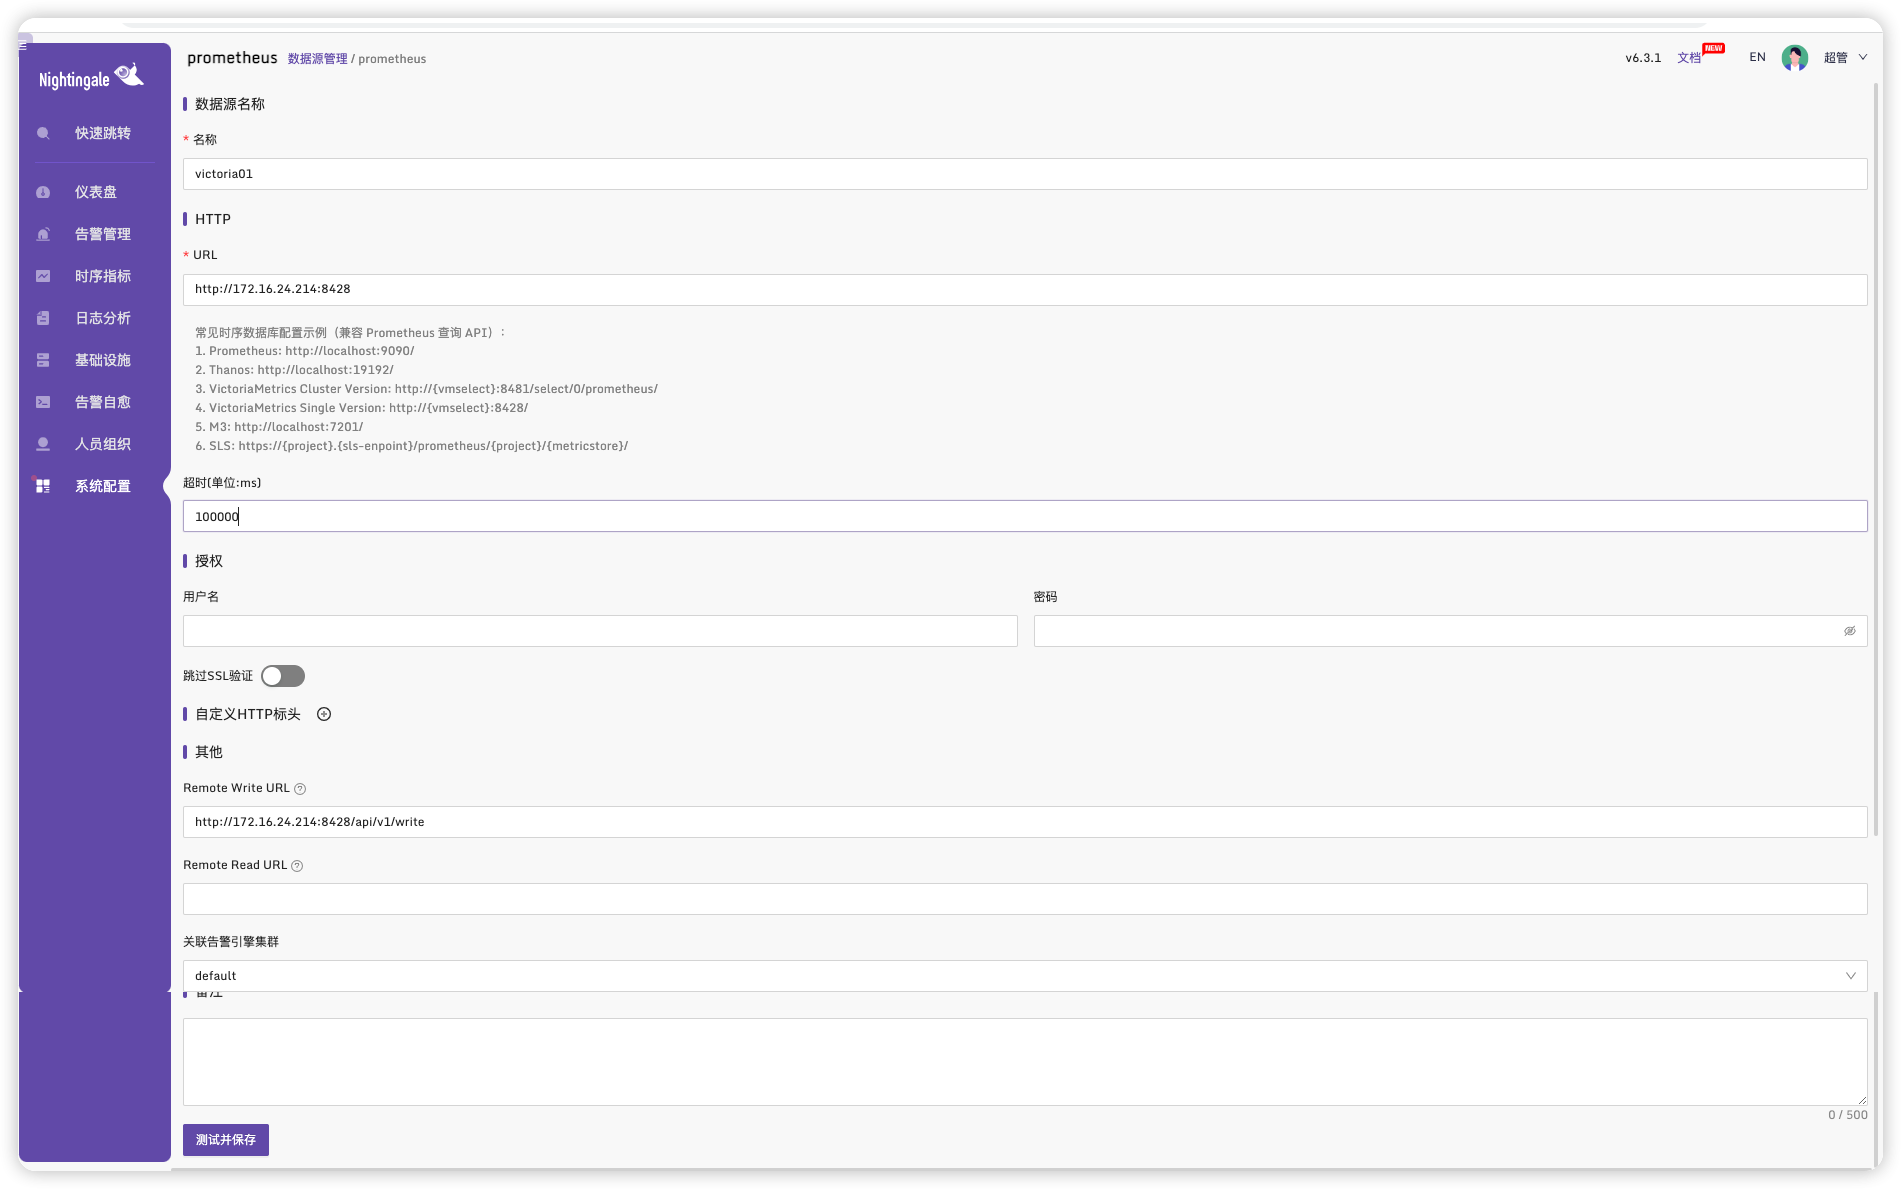
分两个步骤,首先就类似上面配置 Prometheus 数据源那种方式,在夜莺里配置一个 VictoriaMetrics 的数据源,比如我的配置:
填写信息并保存
进入夜莺的配置目录/opt/n9e/etc
cd /opt/n9e/etc
修改配置文件
vim config.toml

# 在 [Pushgw] 下,添加信息
[[Pushgw.Writers]]
Url = "http://172.16.24.214:8428/api/v1/write"
2
3
4
5
重启
pkill n9e
nohup ./n9e &> n9e.log &
2
# 安装Categraf
在网站https://flashcat.cloud/download/categraf/ (opens new window)下载最新版本
# 安装依赖
sudo yum install -y libpcap
# 下载命令
mkdir /opt/categraf && cd  /opt/categraf
wget https://download.flashcat.cloud/categraf-v0.3.32-linux-amd64-with-cgo-plugin.tar.gz
2
# 部署
tar -zxvf categraf-v0.3.32-linux-amd64-with-cgo-plugin.tar.gz
cd categraf-v0.3.32-linux-amd64-with-cgo-plugin
mv ./* ..
2
3
# 修改配置文件
tip:
安装客户端可以使用这个命令一键替换IP
sed -i 's/127.0.0.1/172.16.24.214/g' /opt/categraf/conf/config.toml1
修改文件conf/config.toml
[writer_opt]
# default: 2000
batch = 2000
# channel(as queue) size
chan_size = 10000

[[writers]]
# 修改为夜莺n9e安装的服务器IP地址
url = "http://N9E:17000/prometheus/v1/write"

# Basic auth username
basic_auth_user = ""

# Basic auth password
basic_auth_pass = ""

# timeout settings, unit: ms
timeout = 5000
dial_timeout = 2500
max_idle_conns_per_host = 100
2
3
4
5
6
7
8
9
10
11
12
13
14
15
16
17
18
19
20
# 日志目录设置
[log]
# file_name is the file to write logs to
#file_name = "stdout"
file_name = "/opt/test.log"
2
3
4
打开 Categraf 安装目录下的
conf子目录。使用文本编辑器打开
config.toml文件。找到
[log]部分。取消注释
file_name行(如果已注释),并将其值更改为/opt/test.log。保存对
config.toml文件的更改。重启 Categraf 服务以使新的日志配置生效。
Categraf 的日志就会保存到
/opt目录下的test.log文件中。请确保运行 Categraf 的用户具有对/opt目录的写入权限。
# 设置Linux Systemd托管
cp conf/categraf.service /etc/systemd/system

sudo systemctl daemon-reload
# 以服务方式启动
systemctl start categraf

# 停止服务
systemctl stop categraf

# 重启服务
systemctl restart categraf

# 查看状态
systemctl status categraf
2
3
4
5
6
7
8
9
10
11
12
13
14
启动时可能报错:/opt/categraf/categraf: error while loading shared libraries: libpcap.so.0.8: cannot open shared object file: No such file or directory
没有
libpcap.so.0.8解决方法
# 安装
sudo yum install libpcap -y
# 查看安装版本
ls -al /usr/lib64/libpcap.so*
# 软连接到需要的版本
ln -s /usr/lib64/libpcap.so.1.5.3 /usr/lib64/libpcap.so.0.8
1
2
3
4
5
6
查看运行状态
# systemctl status categraf
● categraf.service - "Categraf"
   Loaded: loaded (/etc/systemd/system/categraf.service; disabled; vendor preset: disabled)
   Active: active (running) since Wed 2023-10-18 13:33:22 CST; 3s ago
 Main PID: 2104 (categraf)
   CGroup: /system.slice/categraf.service
           └─2104 /opt/categraf/categraf

Oct 18 13:33:22 centos7.9-template categraf[2104]: 2023/10/18 13:33:22 metrics_agent.go:299: I! input: local.mem started
Oct 18 13:33:22 centos7.9-template categraf[2104]: 2023/10/18 13:33:22 metrics_agent.go:299: I! input: local.net started
Oct 18 13:33:22 centos7.9-template categraf[2104]: 2023/10/18 13:33:22 metrics_agent.go:299: I! input: local.netstat started
Oct 18 13:33:22 centos7.9-template categraf[2104]: 2023/10/18 13:33:22 metrics_agent.go:299: I! input: local.nfsclient started
Oct 18 13:33:22 centos7.9-template categraf[2104]: 2023/10/18 13:33:22 metrics_agent.go:299: I! input: local.processes started
Oct 18 13:33:22 centos7.9-template categraf[2104]: 2023/10/18 13:33:22 metrics_agent.go:299: I! input: local.self_metrics started
Oct 18 13:33:22 centos7.9-template categraf[2104]: 2023/10/18 13:33:22 metrics_agent.go:299: I! input: local.sockstat started
Oct 18 13:33:22 centos7.9-template categraf[2104]: 2023/10/18 13:33:22 metrics_agent.go:299: I! input: local.system started
Oct 18 13:33:22 centos7.9-template categraf[2104]: 2023/10/18 13:33:22 agent.go:47: I! [*agent.MetricsAgent] started
Oct 18 13:33:22 centos7.9-template categraf[2104]: 2023/10/18 13:33:22 agent.go:50: I! agent started
2
3
4
5
6
7
8
9
10
11
12
13
14
15
16
17
18
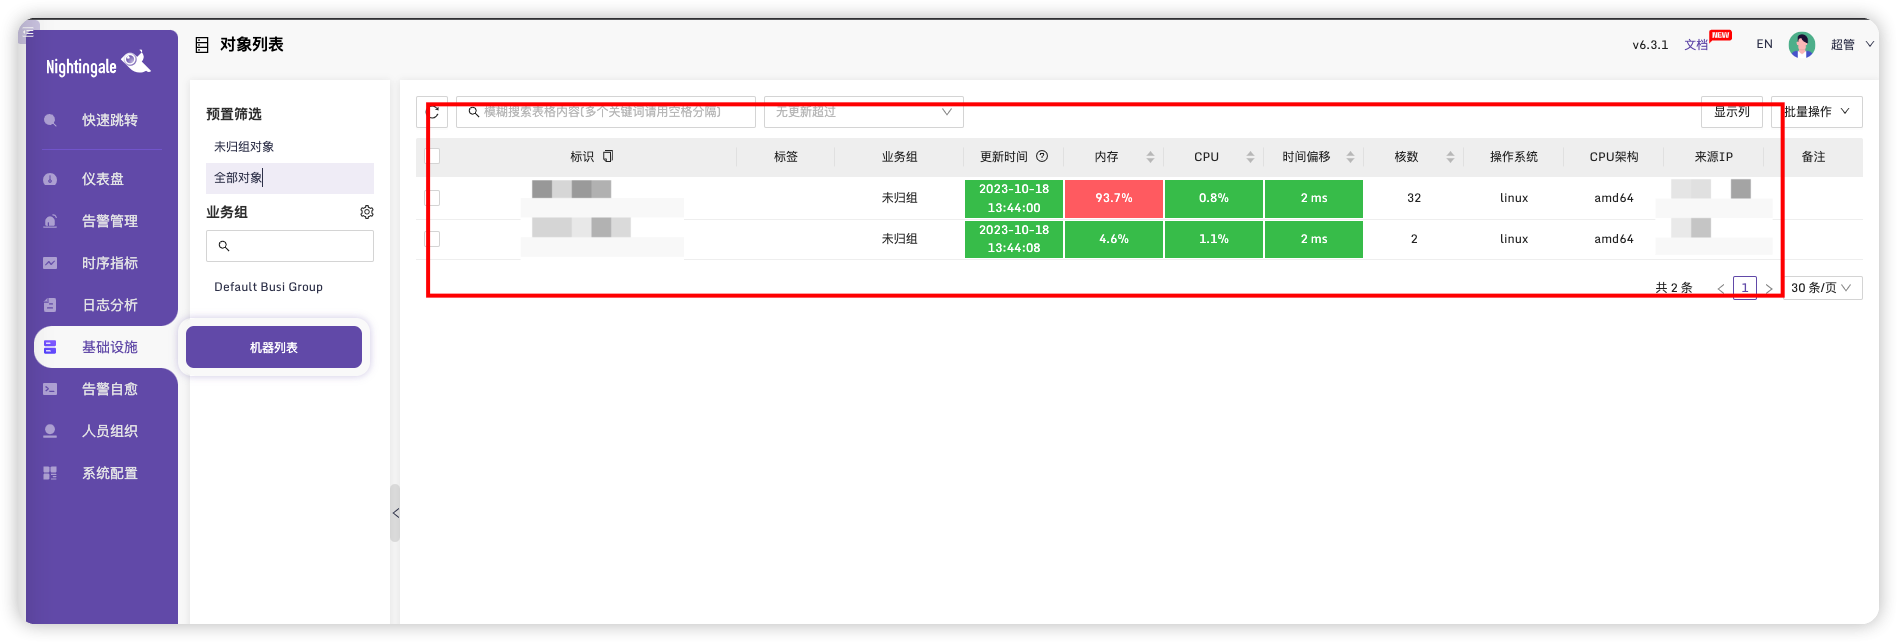
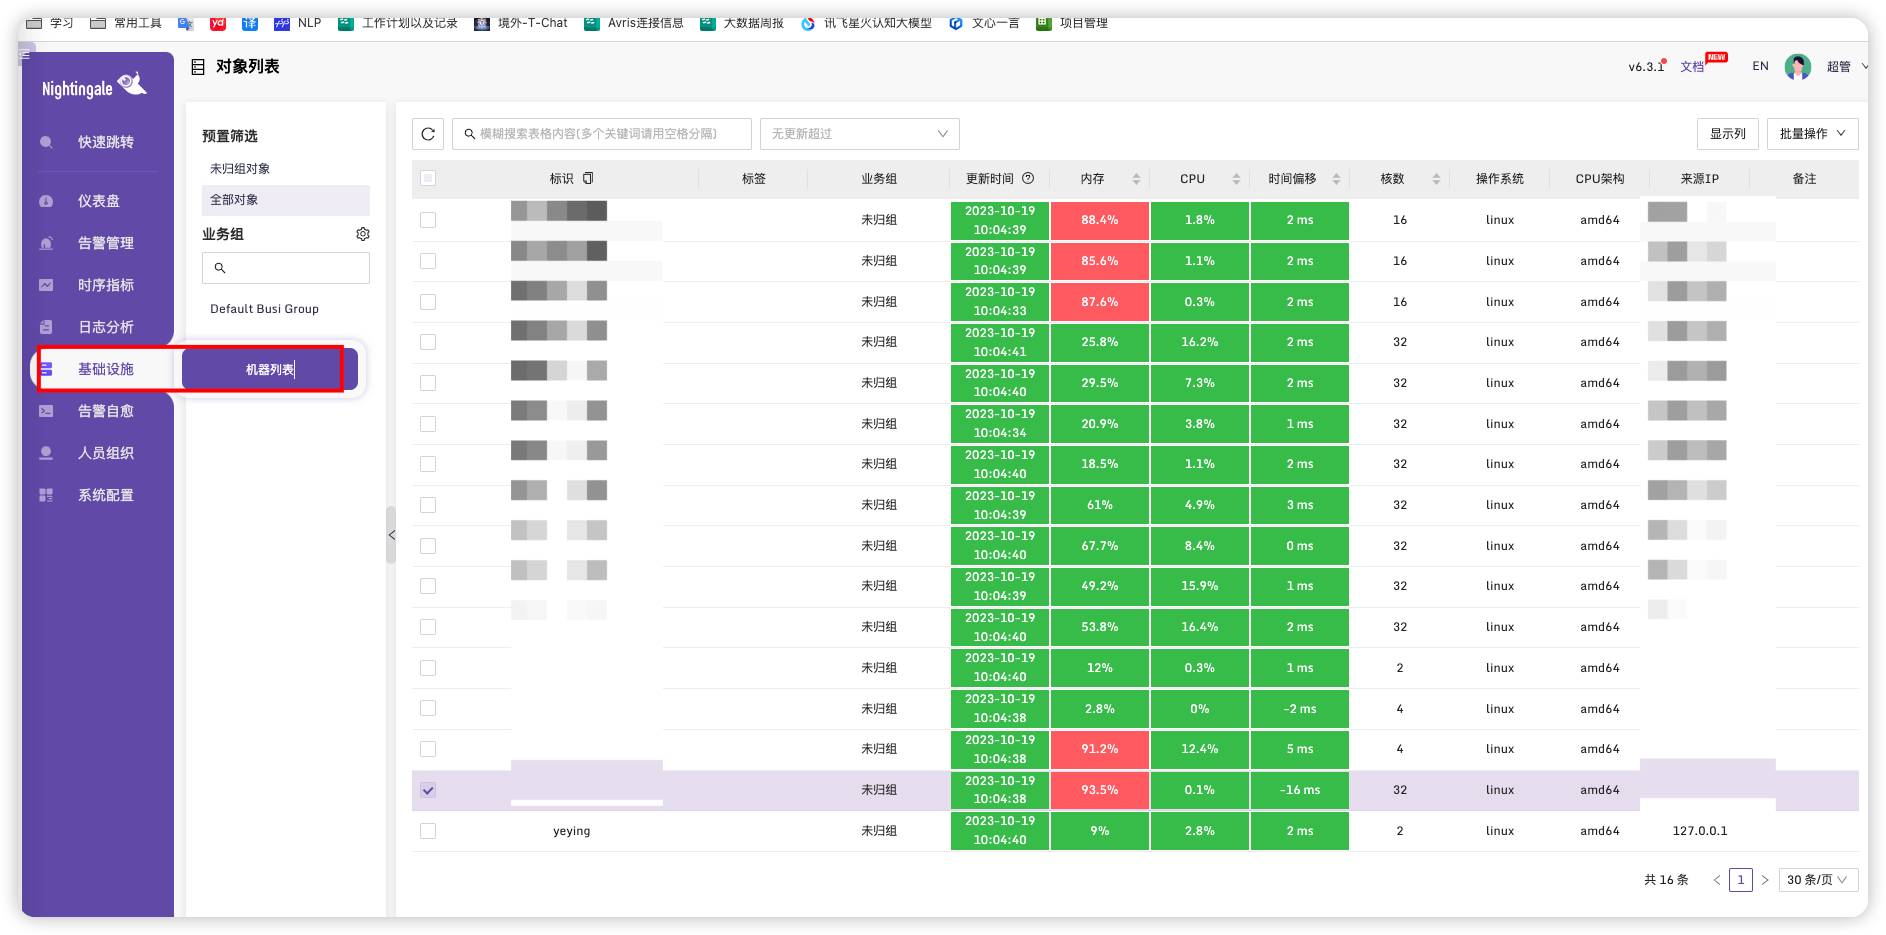
安装完成后可以在基础设施中查看到机器的状态
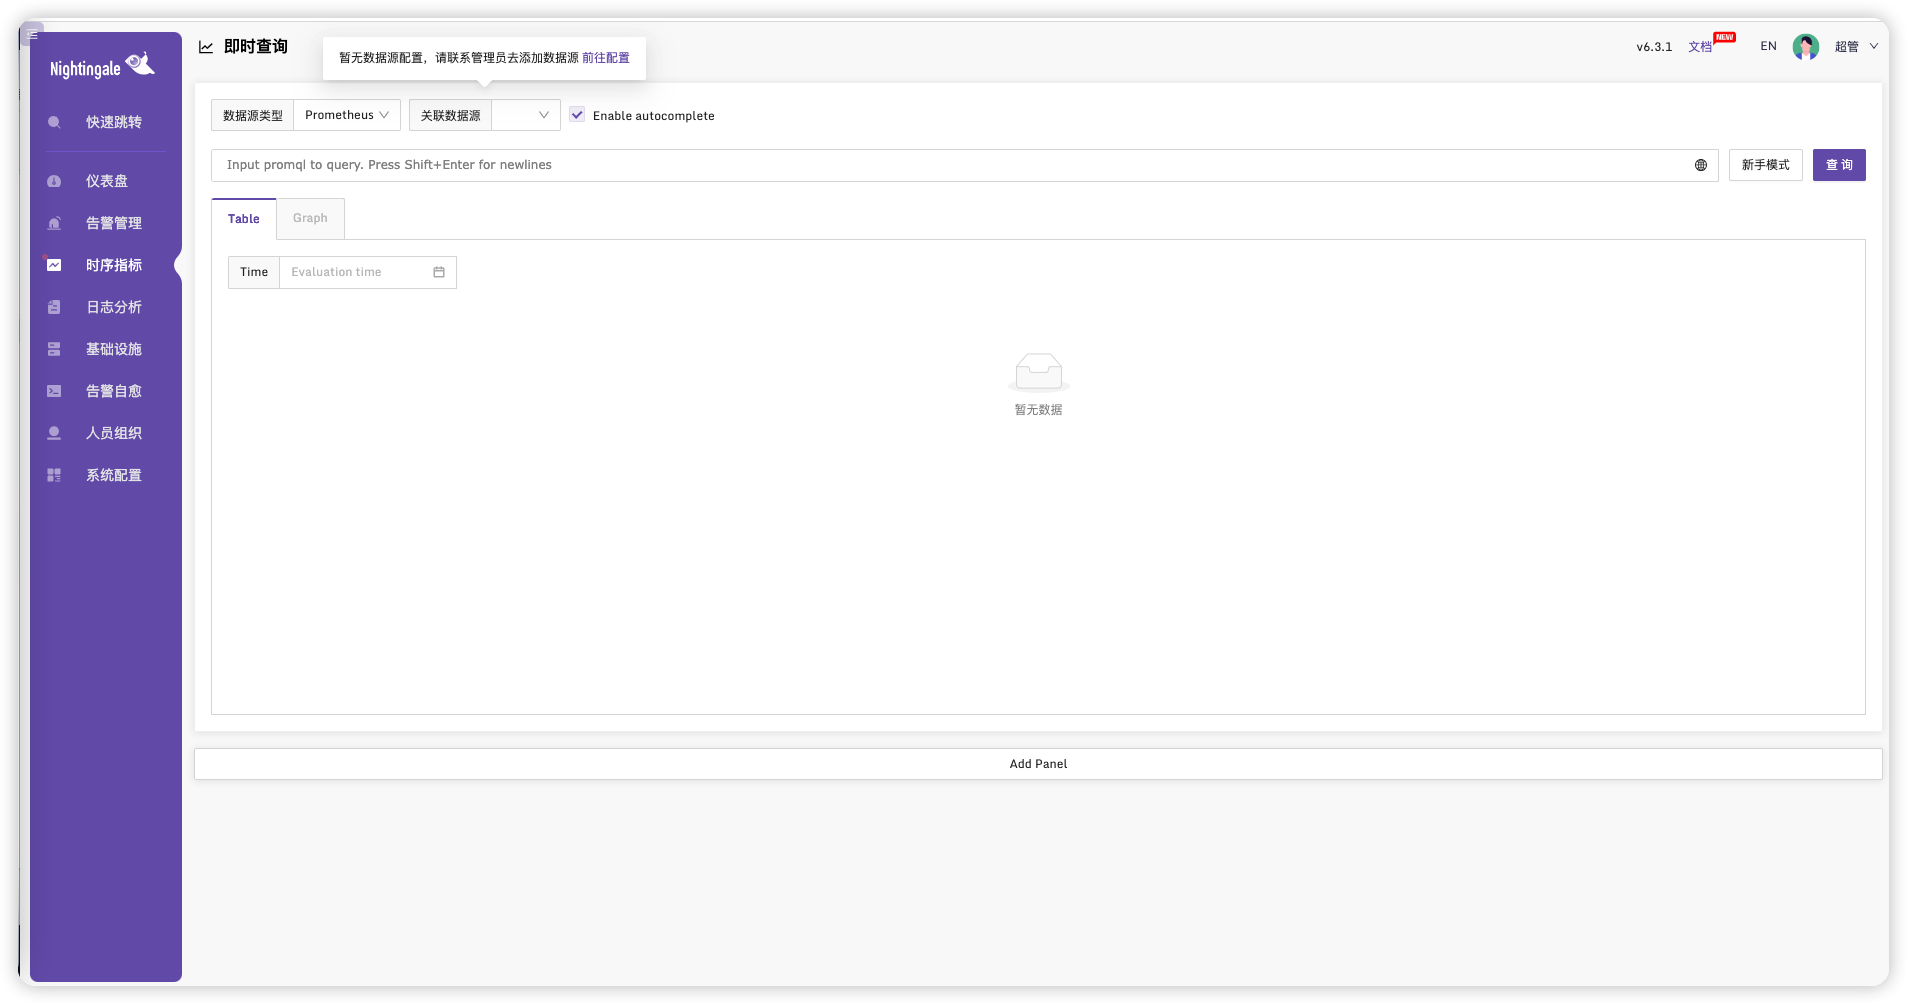
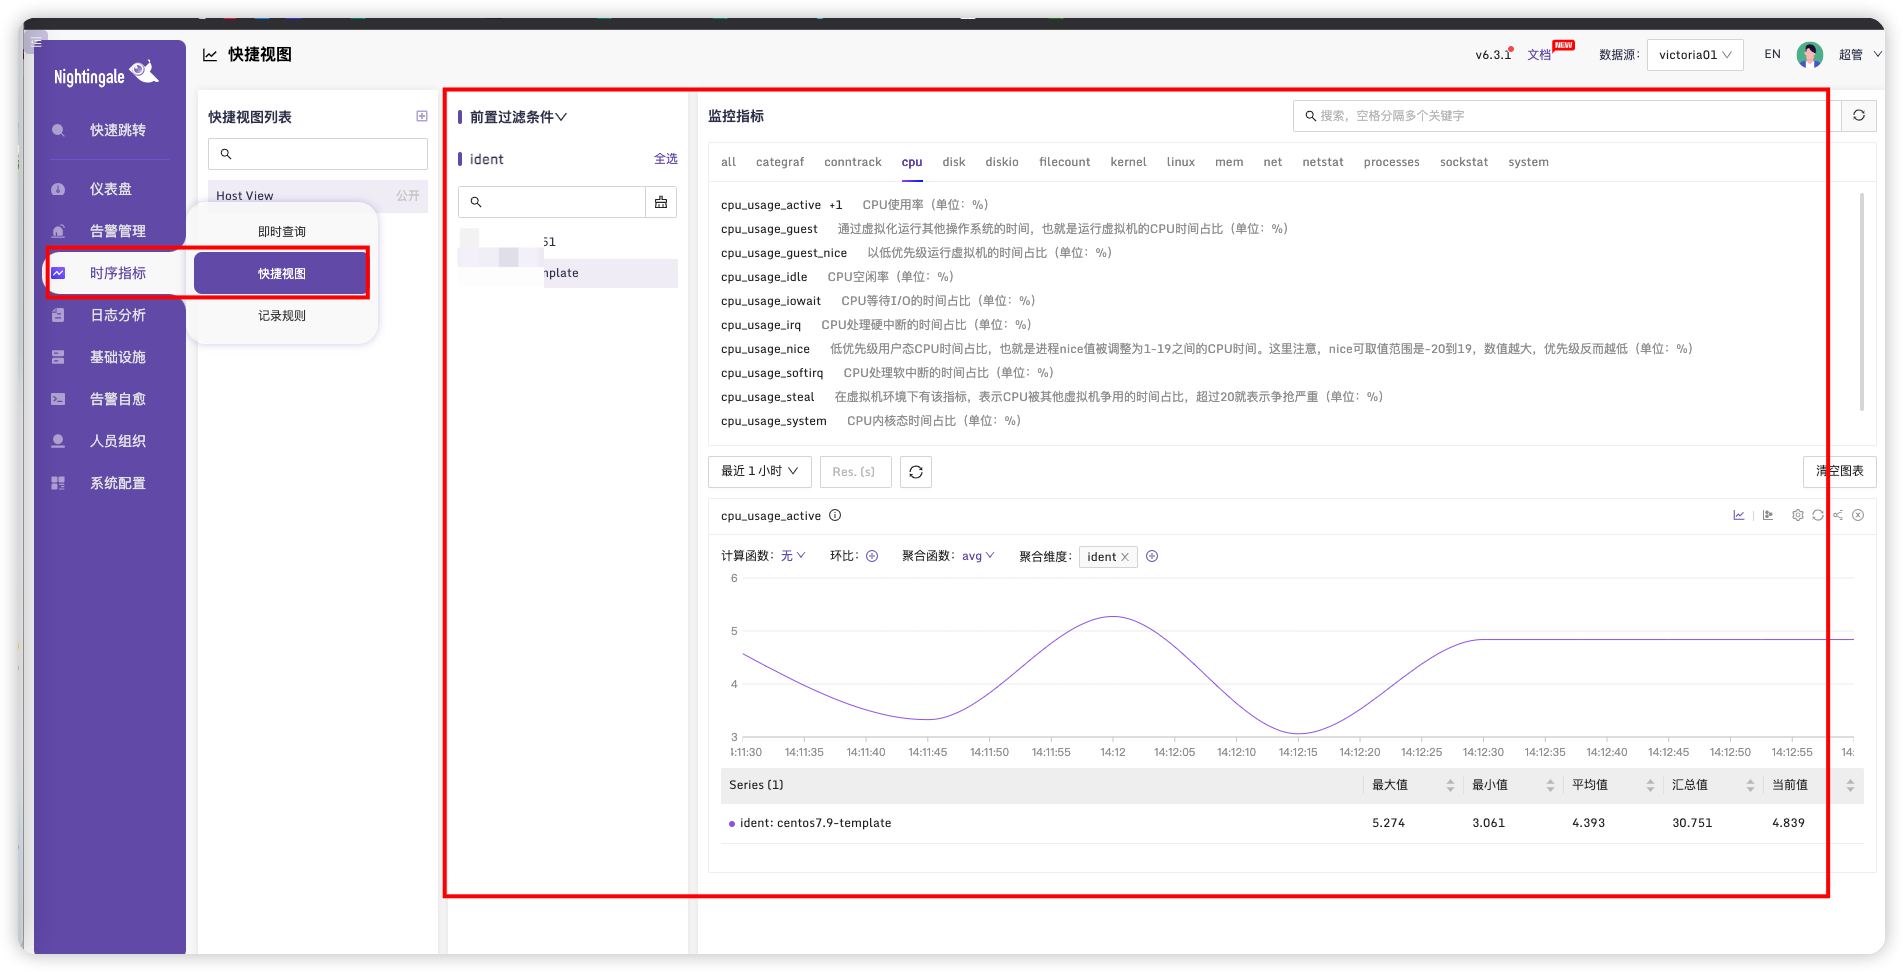
# 查看时序指标
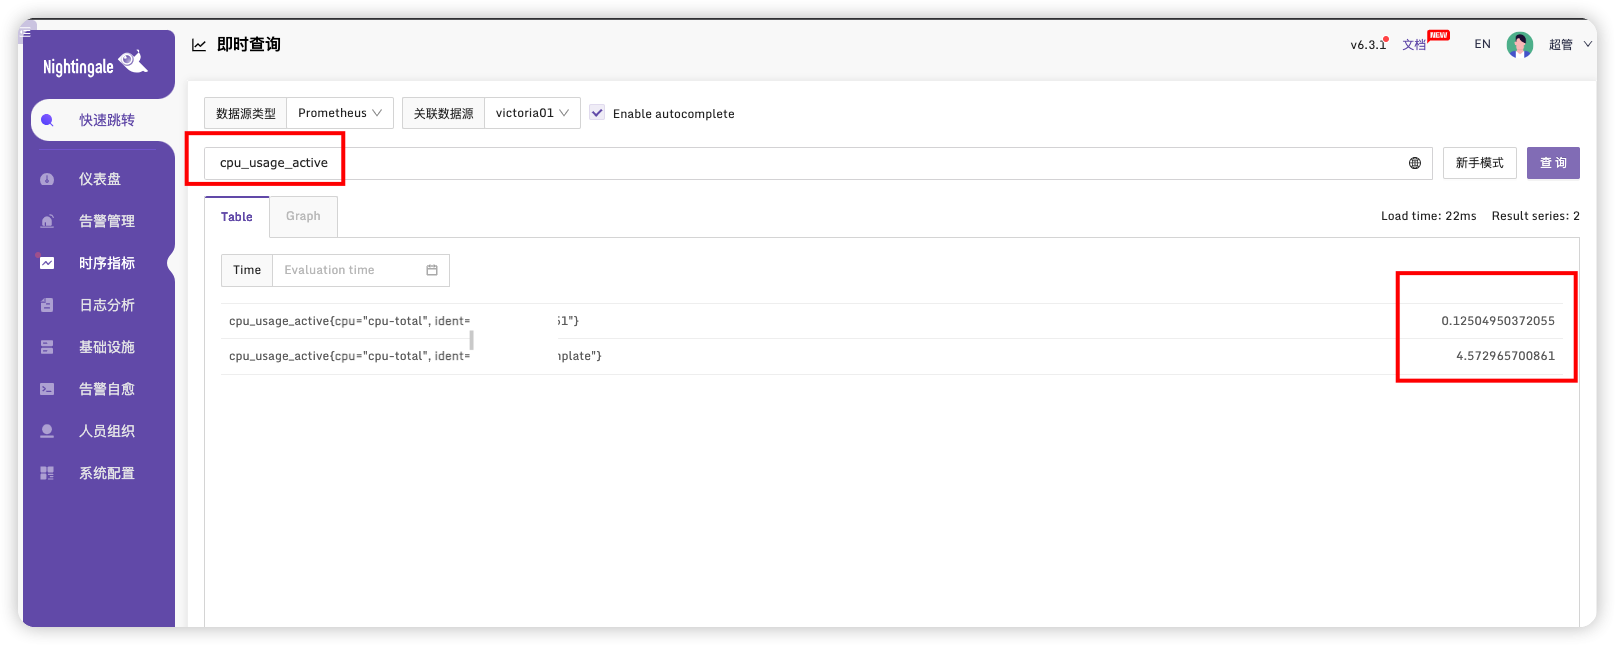
也可以在这个页面快速查看
# 多节点监控
与上面步骤相同,只需要部署多个Categraf即可
# 配置服务器监控
上面步骤我们已经在页面通过Victoria查询出数据,这里我们选择展示仪表盘
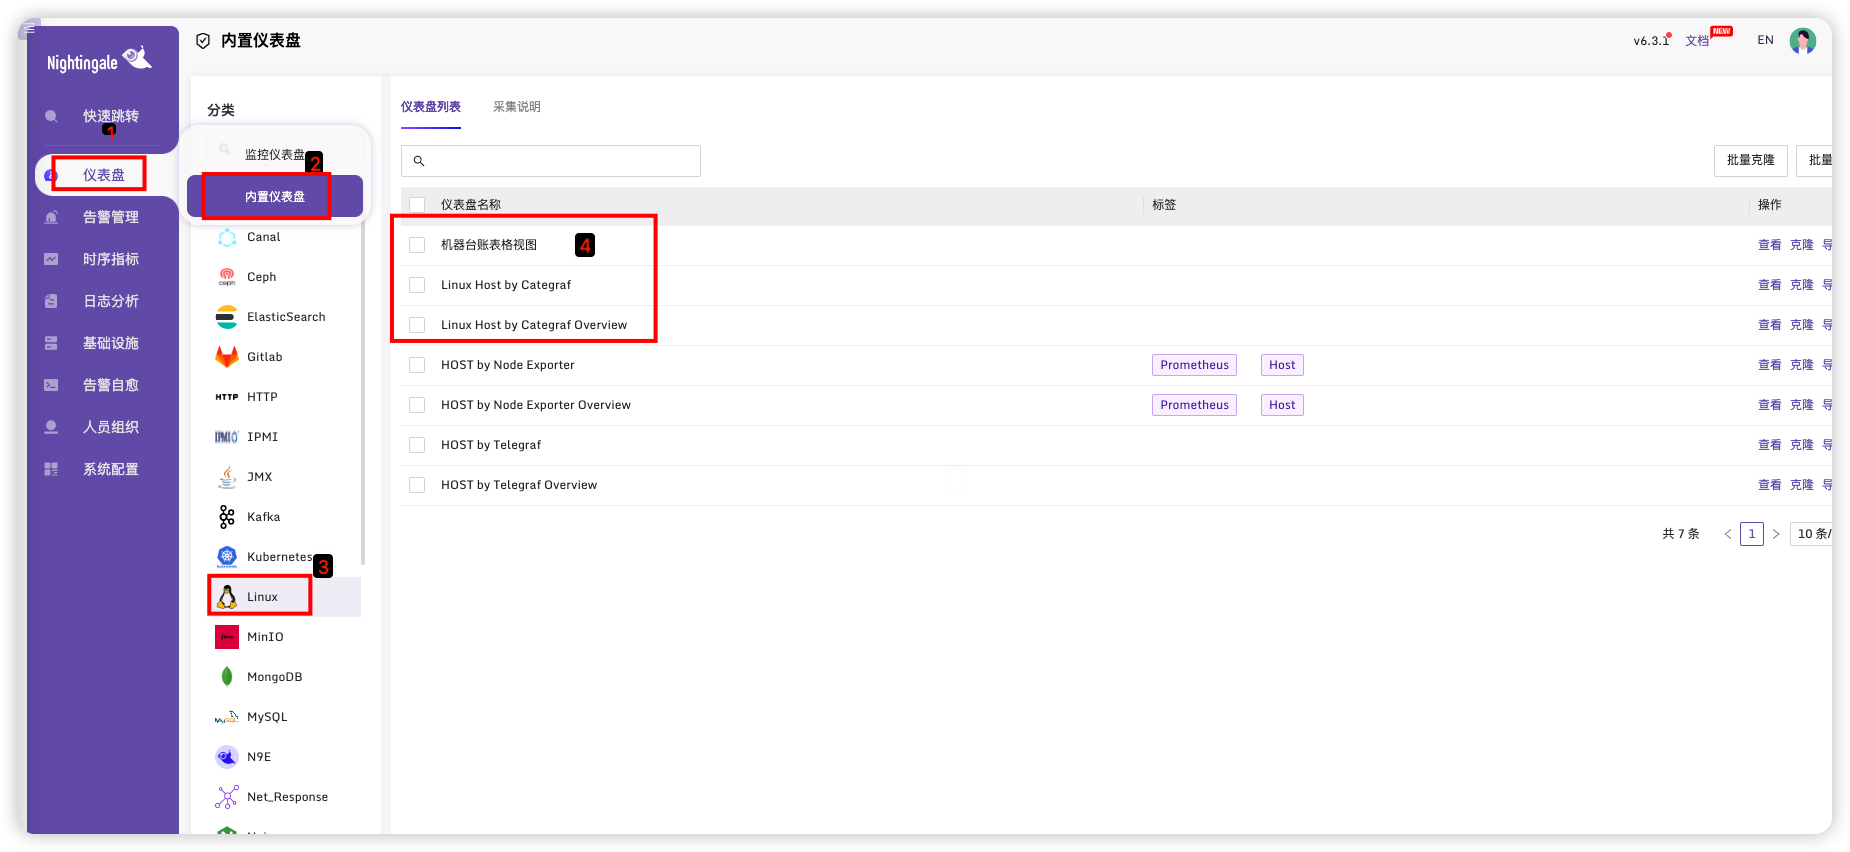
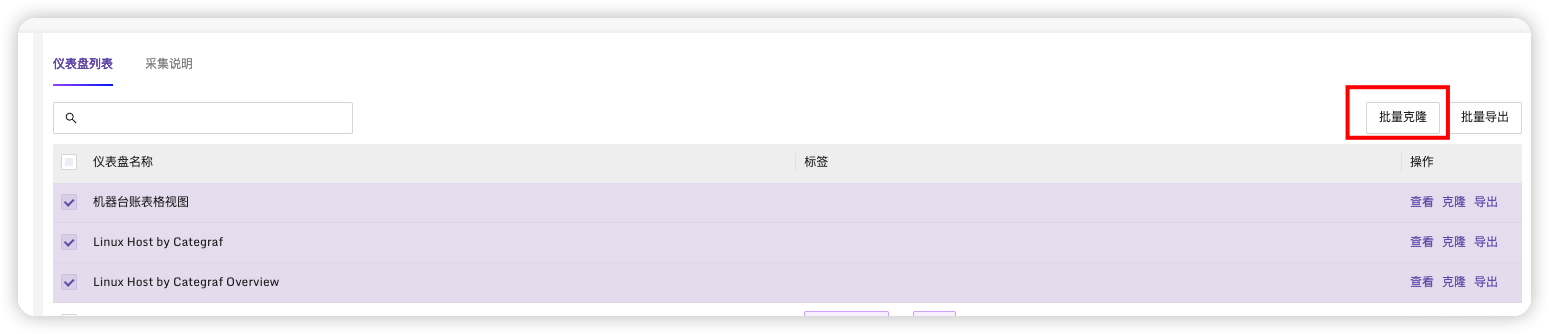
选择前三个模板,点击批量导出
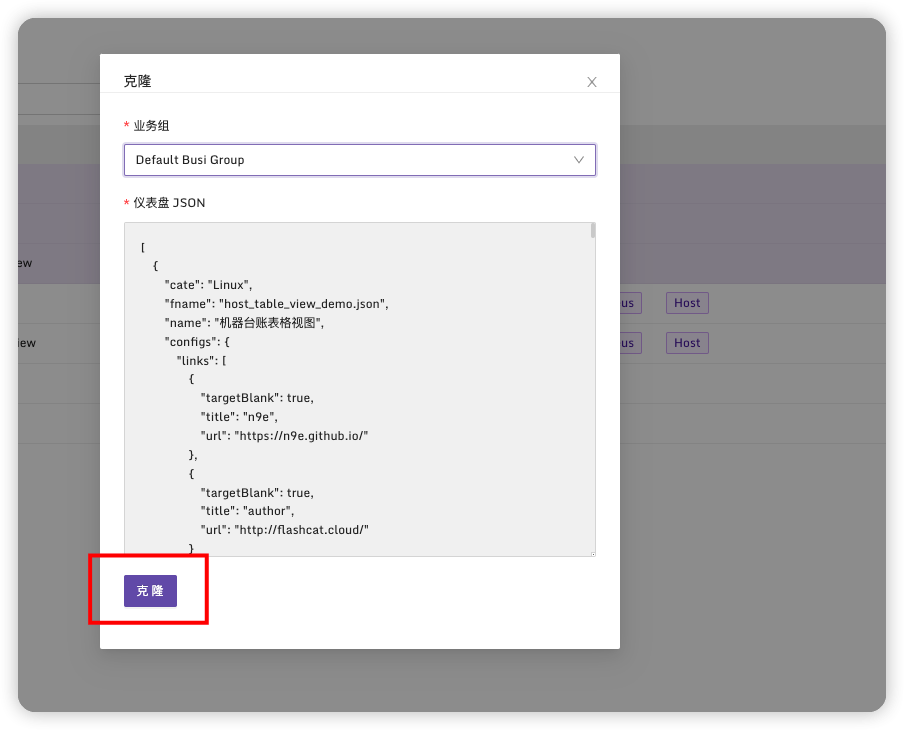
选择业务组后点击克隆
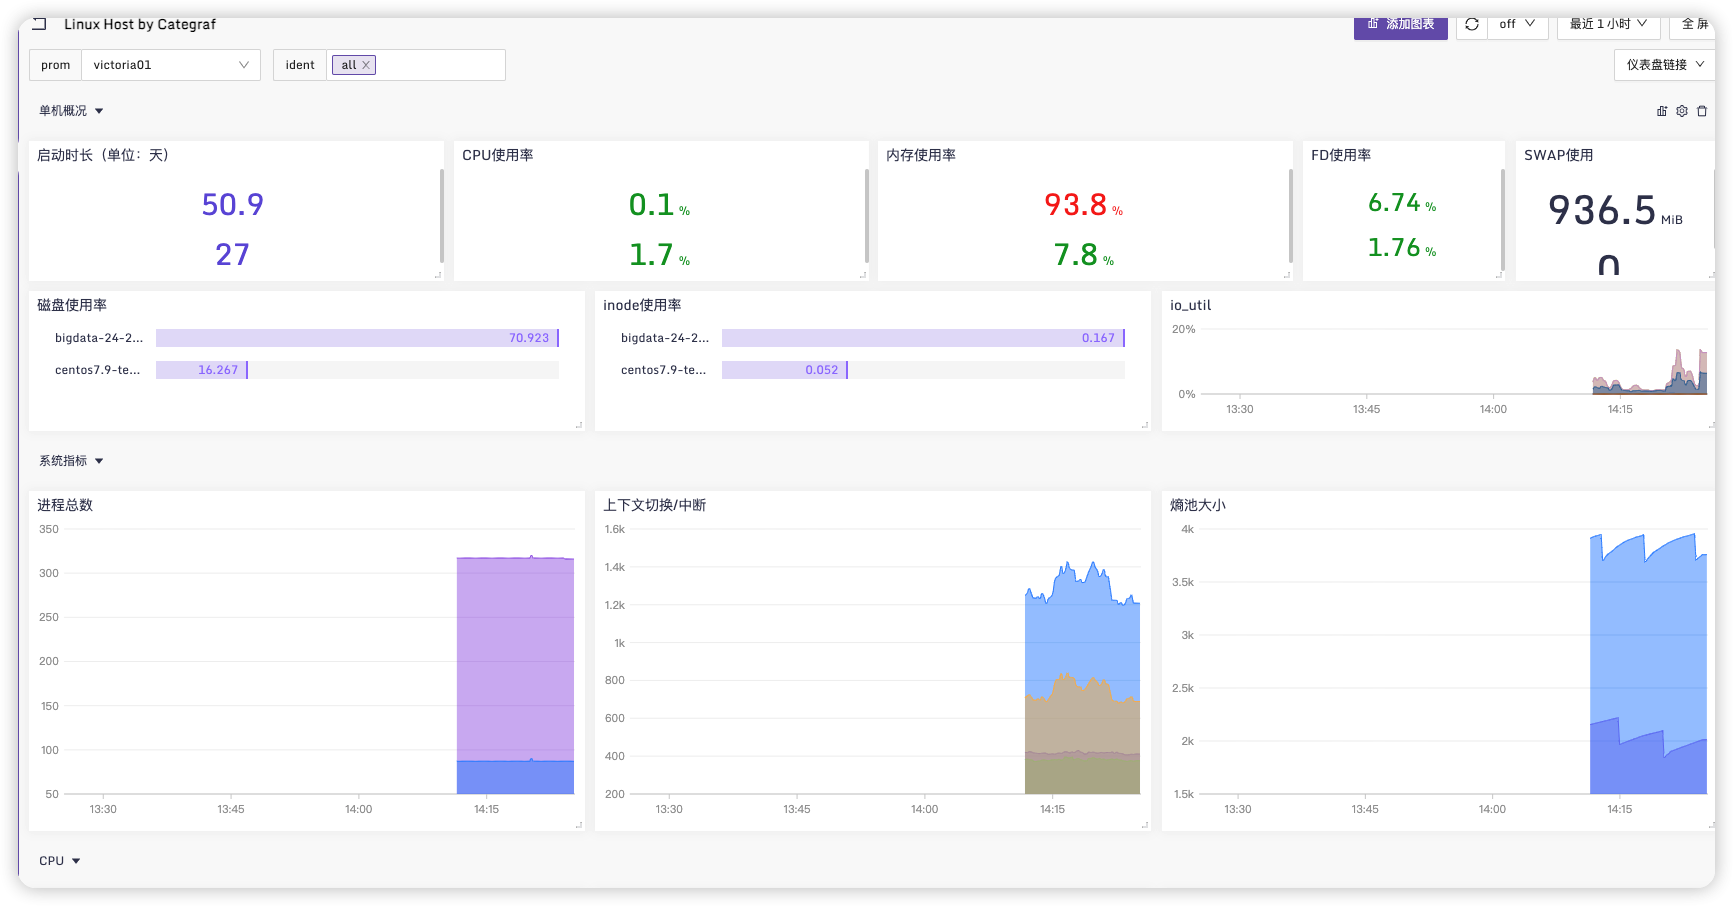
在仪表盘->监控仪表盘中可以看到三个仪表盘
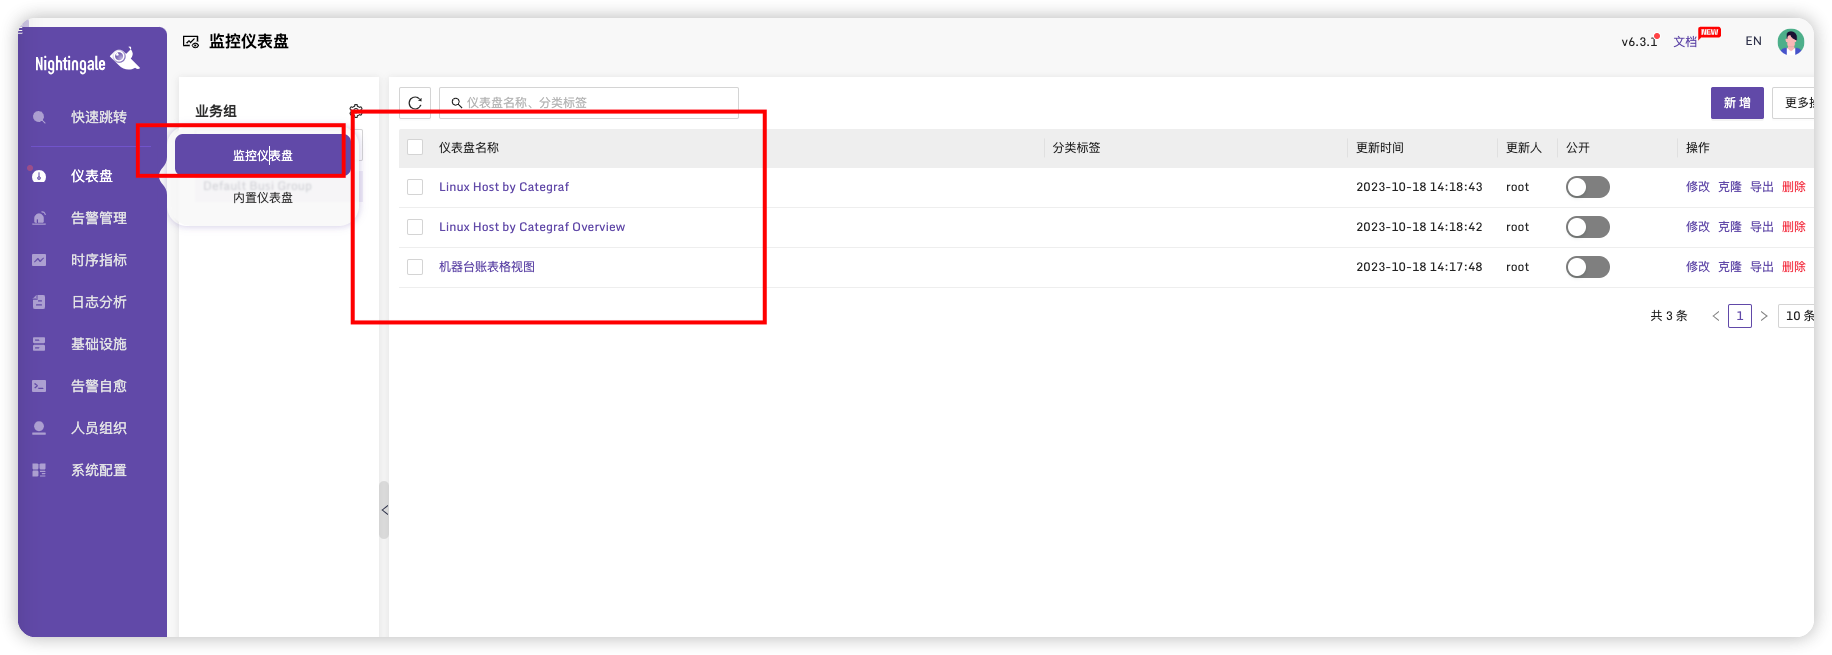
点进去后可以看到不同展示监控页面
# 监控MySQL
官方配置说明:https://flashcat.cloud/docs/content/flashcat-monitor/categraf/plugin/mysql/ (opens new window)
# 修改categraf配置文件
vim conf/input.mysql/mysql.toml
内容如下(真实监控的配置文件)
# # collect interval
# interval = 15

# [[queries]]
# mesurement = "users"
# metric_fields = [ "total" ]
# label_fields = [ "service" ]
# timeout = "3s"
# request = '''
# select 'n9e' as service, count(*) as total from n9e_v5.users
# '''


[[instances]]
 address = "172.1.2.1:3306"
 username = "root"
 password = "root"

# # set tls=custom to enable tls
 parameters = "tls=false"

 extra_status_metrics = true
 extra_innodb_metrics = false
 gather_processlist_processes_by_state = false
 gather_processlist_processes_by_user = false
 gather_schema_size = true
 gather_table_size = true
 gather_system_table_size = false
 gather_slave_status = true

# # timeout
 timeout_seconds = 3

# # interval = global.interval * interval_times
 interval_times = 1

# important! use global unique string to specify instance
# labels = { instance="n9e-10.2.3.4:3306" }

## Optional TLS Config
# use_tls = false
# tls_min_version = "1.2"
# tls_ca = "/etc/categraf/ca.pem"
# tls_cert = "/etc/categraf/cert.pem"
# tls_key = "/etc/categraf/key.pem"
## Use TLS but skip chain & host verification
# insecure_skip_verify = true

#[[instances.queries]]
# mesurement = "lock_wait"
# metric_fields = [ "total" ]
# timeout = "3s"
# request = '''
#SELECT count(*) as total FROM information_schema.innodb_trx WHERE trx_state='LOCK WAIT'
#'''

# [[instances.queries]]
# mesurement = "users"
# metric_fields = [ "total" ]
# label_fields = [ "service" ]
# # field_to_append = ""
# timeout = "3s"
# request = '''
# select 'n9e' as service, count(*) as total from n9e_v5.users
# '''
2
3
4
5
6
7
8
9
10
11
12
13
14
15
16
17
18
19
20
21
22
23
24
25
26
27
28
29
30
31
32
33
34
35
36
37
38
39
40
41
42
43
44
45
46
47
48
49
50
51
52
53
54
55
56
57
58
59
60
61
62
63
64
65
66
配置文件说明如下:
# # 定义mysql采集周期
interval = 15

# 定义全局要执行的sql
  [[queries]]
  mesurement = "users"
  metric_fields = [ "total" ]
  label_fields = [ "service" ]
  timeout = "3s"
  request = '''
  select 'n9e' as service, count(*) as total from n9e_v5.users
  '''

# 定义instance, 一个instance对应一个mysql实例
# 指定mysql的地址,用户名,密码
[[instances]]
  address = "127.0.0.1:3306"
  username = "root"
  password = "1234"

# # 是否使用tls 等定制参数
  parameters = "tls=false"

# 通过 show global status监控mysql,默认抓取一些基础指标,
# 如果想抓取更多global status的指标,把下面的配置设置为true
  extra_status_metrics = true

# 通过show global variables监控mysql的全局变量,默认抓取一些常规的
# 常规的基本够用了,扩展的部分,默认不采集,下面的配置设置为false
  extra_innodb_metrics = false

# 监控processlist,关注较少,默认不采集
  gather_processlist_processes_by_state = false
  gather_processlist_processes_by_user = false

# 监控各个数据库的磁盘占用大小
  gather_schema_size = true

# 监控所有的table的磁盘占用大小
  gather_table_size = false

# 是否采集系统表的大小,通常不用,所以默认设置为false
  gather_system_table_size = false

# 通过 show slave status监控slave的情况,比较关键,所以默认采集
  gather_slave_status = true


# # 超时时间
  timeout_seconds = 3

# 采集周期的倍数,比如设置为2,那么采集周期就是 interval * 2
  interval_times = 1

# 为mysql实例附一个instance的标签,因为通过address=127.0.0.1:3306不好区分
  labels = { instance="n9e-10.2.3.4:3306" }

 # # tls相关配置  可选配置
 # Optional TLS Config
  use_tls = false
  tls_min_version = "1.2"
  tls_ca = "/etc/categraf/ca.pem"
  tls_cert = "/etc/categraf/cert.pem"
  tls_key = "/etc/categraf/key.pem"
 # Use TLS but skip chain & host verification
  insecure_skip_verify = true

  # 定义当前instance的sql
 [[instances.queries]]
  mesurement = "lock_wait"
  metric_fields = [ "total" ]
  timeout = "3s"
  request = '''
  SELECT count(*) as total FROM information_schema.innodb_trx WHERE trx_state='LOCK WAIT'
  '''
2
3
4
5
6
7
8
9
10
11
12
13
14
15
16
17
18
19
20
21
22
23
24
25
26
27
28
29
30
31
32
33
34
35
36
37
38
39
40
41
42
43
44
45
46
47
48
49
50
51
52
53
54
55
56
57
58
59
60
61
62
63
64
65
66
67
68
69
70
71
72
73
74
75
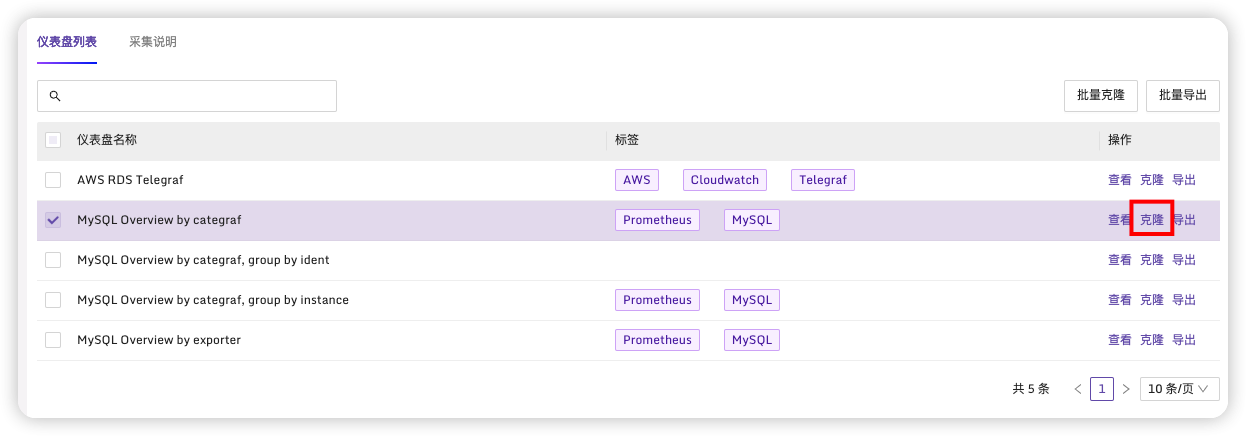
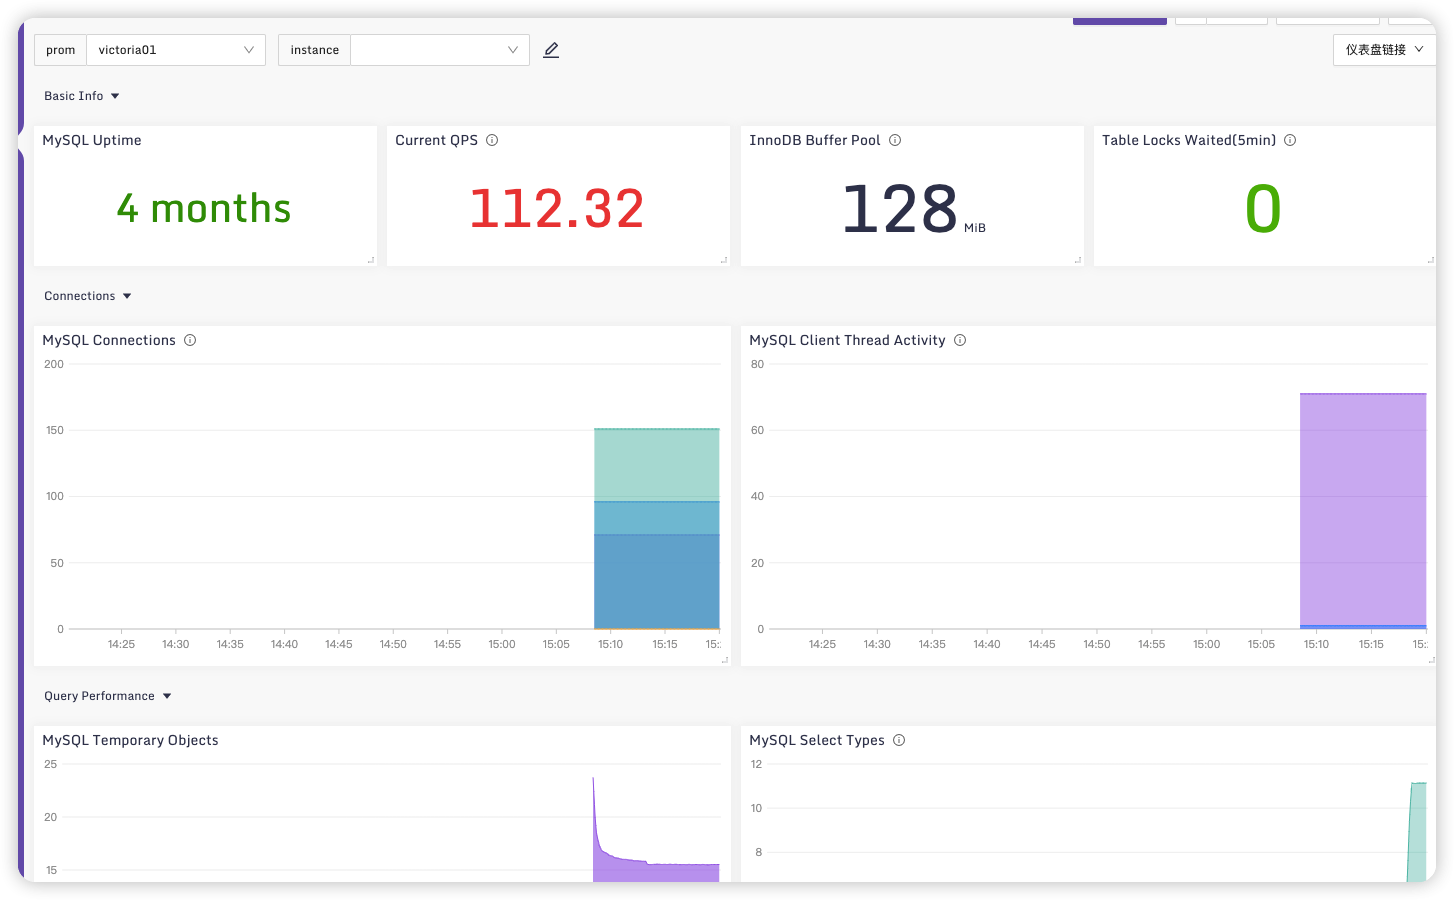
# 配置仪表盘
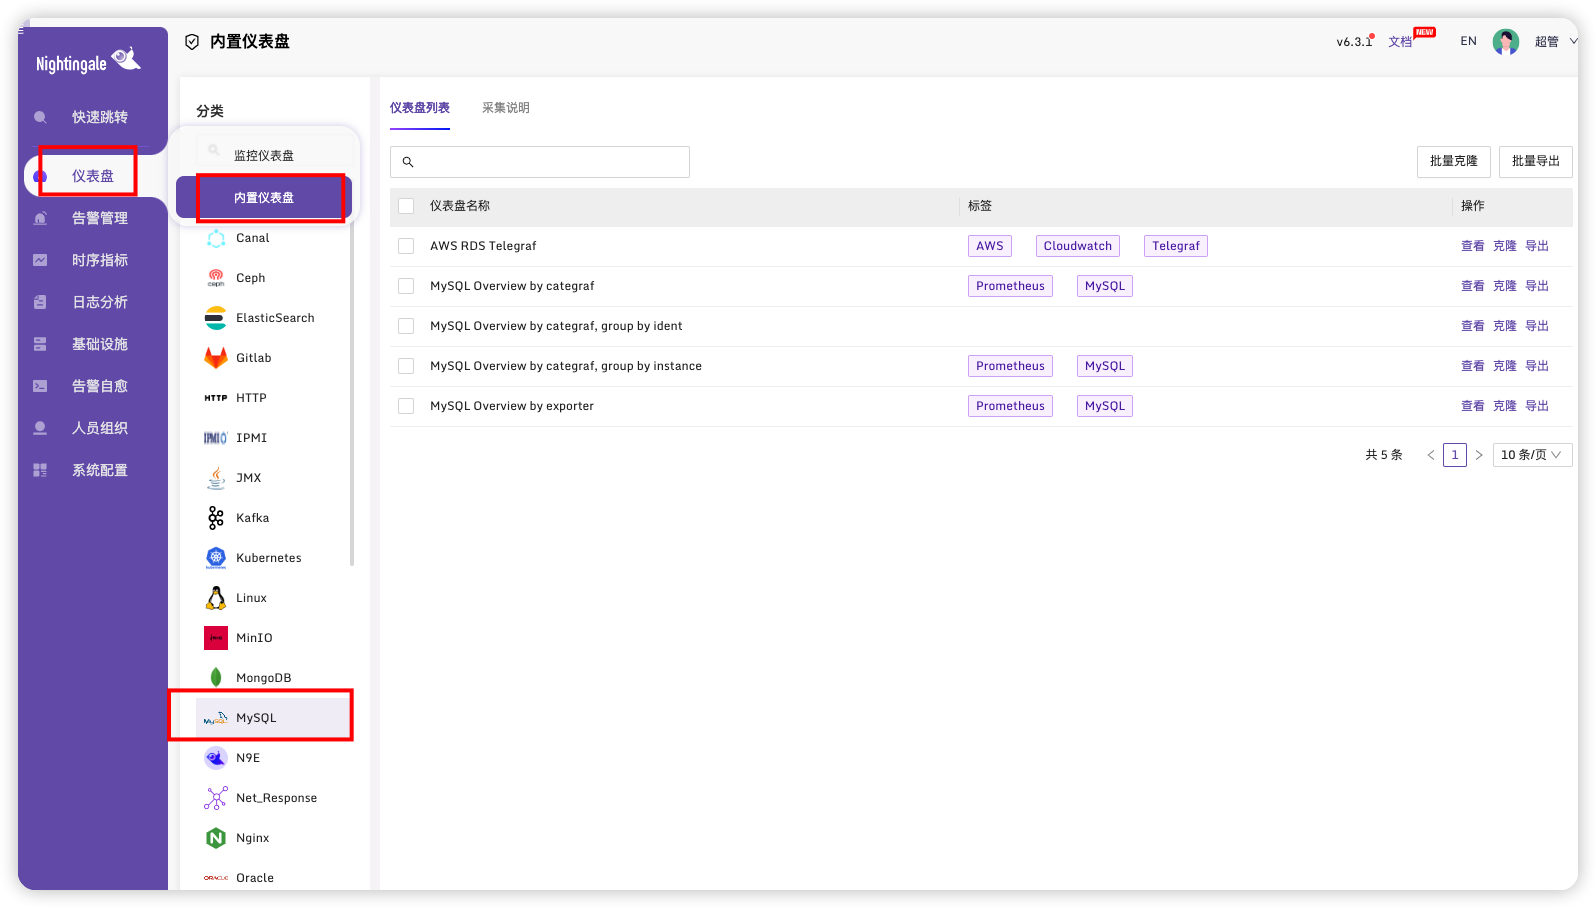
选择克隆
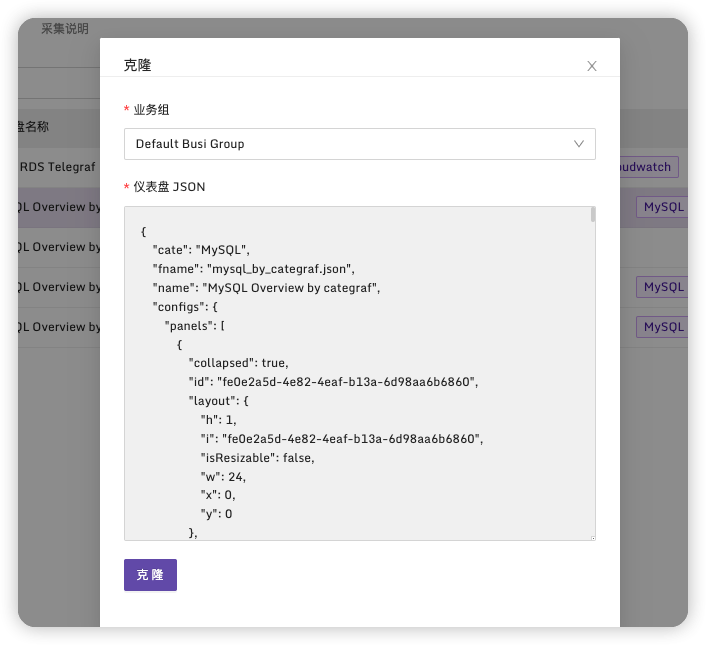
在仪表盘页面进入该监控,可以看到MySQL监控
# 监控进程
官方说明:https://flashcat.cloud/docs/content/flashcat-monitor/categraf/plugin/procstat/ (opens new window)
# 修改categraf配置文件
vim conf/input.procstat/procstat.toml
监控categraf与categraf进程
注意:如果配置多个监控,要将下面每个详细配置都单独配置一遍
# # collect interval
interval = 15
[[instances]]
  search_cmdline_substring ="categraf"
  gather_total = true
	gather_per_pid = false
 	gather_more_metrics = [
     "threads",
     "fd",
     "io",
     "uptime",
     "cpu",
     "mem",
     "limit",
     "jvm"
 	]
[[instances]]
# # executable name (ie, pgrep <search_exec_substring>)
#search_exec_substring = "nginx"

# # pattern as argument for pgrep (ie, pgrep -f <search_cmdline_substring>)
 search_cmdline_substring ="paddlenlp"

# # windows service name
# search_win_service = ""

# # search process with specific user, option with exec_substring or cmdline_substring
# search_user = ""

# # append some labels for series
# labels = { region="cloud", product="n9e" }

# # interval = global.interval * interval_times
# interval_times = 1

# # mode to use when calculating CPU usage. can be one of 'solaris' or 'irix'
# mode = "irix"

# sum of threads/fd/io/cpu/mem, min of uptime/limit
gather_total = true

# will append pid as tag
gather_per_pid = false

#  gather jvm metrics only when jstat is ready
 gather_more_metrics = [
     "threads",
     "fd",
     "io",
     "uptime",
     "cpu",
     "mem",
     "limit",
     "jvm"
 ]
2
3
4
5
6
7
8
9
10
11
12
13
14
15
16
17
18
19
20
21
22
23
24
25
26
27
28
29
30
31
32
33
34
35
36
37
38
39
40
41
42
43
44
45
46
47
48
49
50
51
52
53
54
55
去注释版本
interval = 15
[[instances]]
  search_cmdline_substring ="categraf"
  gather_total = true
	gather_per_pid = false
 	gather_more_metrics = [
     "threads",
     "fd",
     "io",
     "uptime",
     "cpu",
     "mem",
     "limit",
     "jvm"
 	]
[[instances]]
search_cmdline_substring ="paddlenlp"
gather_total = true
gather_per_pid = false
gather_more_metrics = [
     "threads",
     "fd",
     "io",
     "uptime",
     "cpu",
     "mem",
     "limit",
     "jvm"
 ]
2
3
4
5
6
7
8
9
10
11
12
13
14
15
16
17
18
19
20
21
22
23
24
25
26
27
28
29
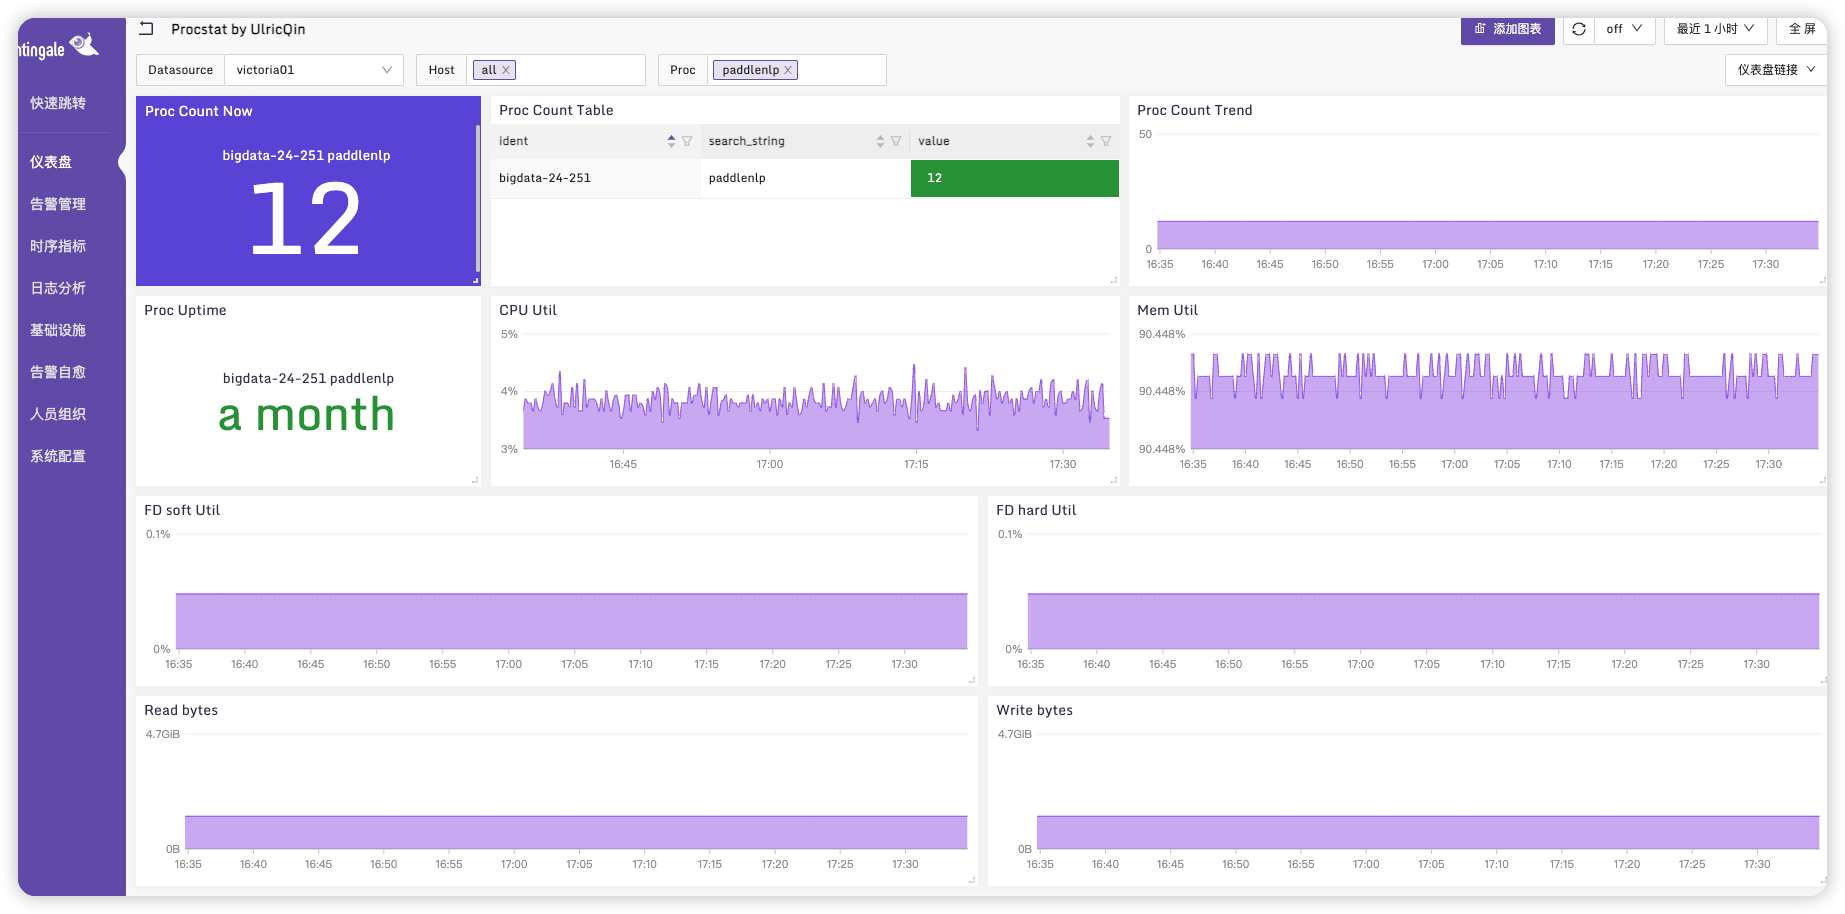
选择仪表盘
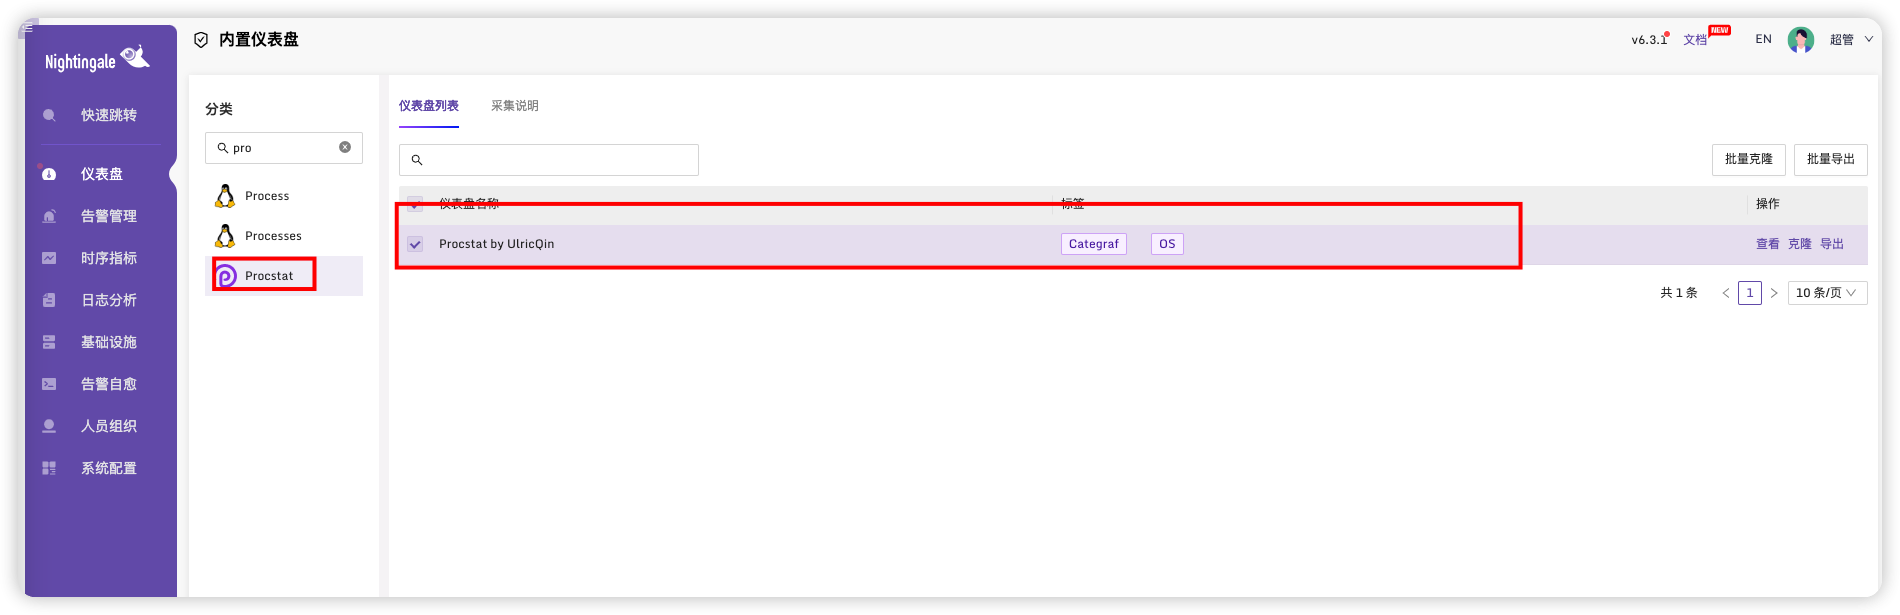
克隆
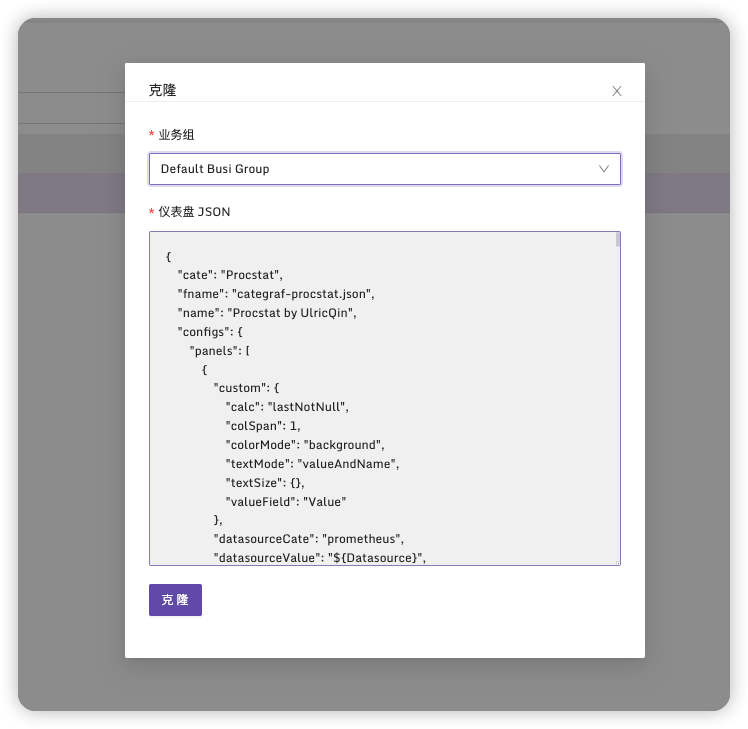
点击进入可以看到监控状态
# 告警配置
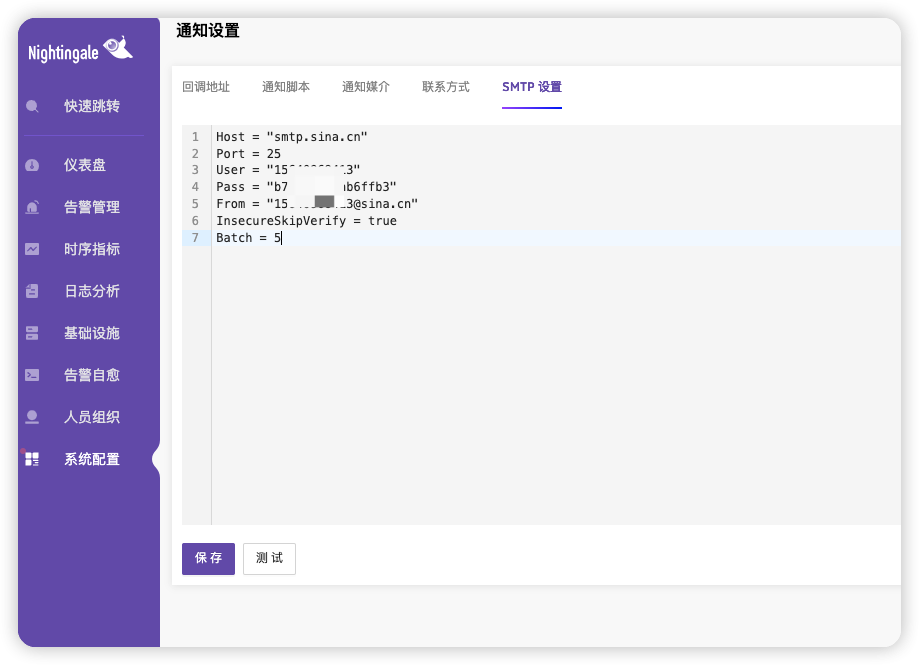
进入 系统配置 -> 通知设置 -> SMTP设置
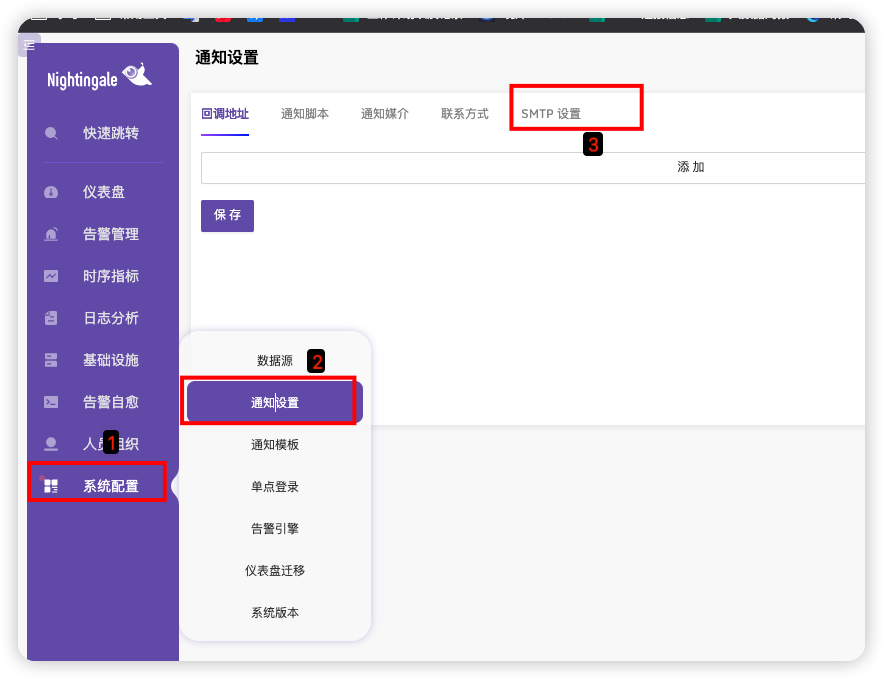
配置发送预警邮箱
进入告警管理->内置规则

选择 Procstat
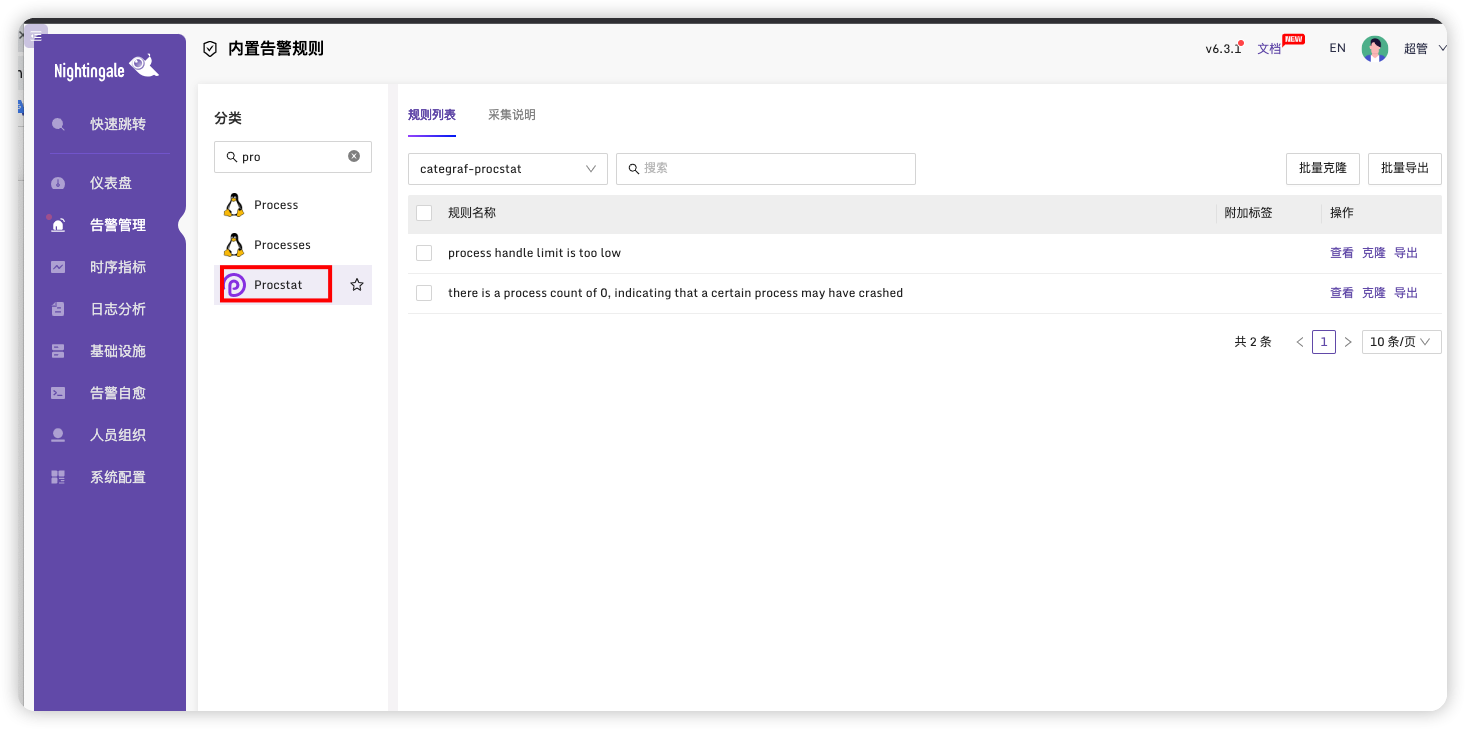
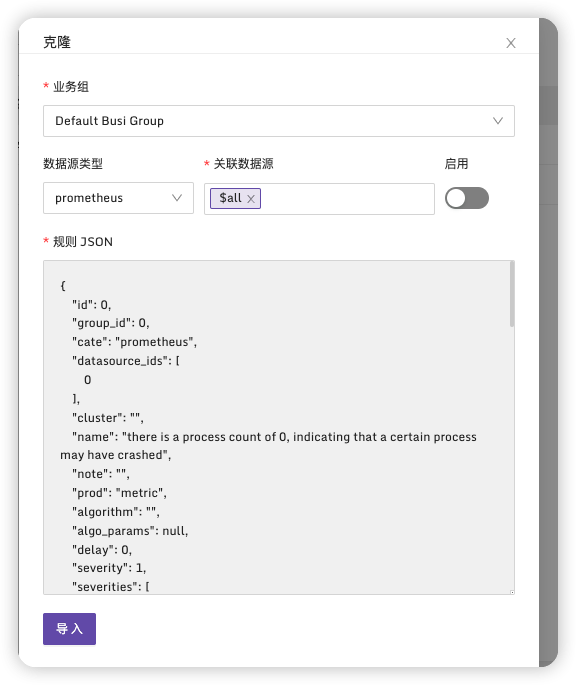
选择第二个,并点击克隆,这个选项为当监控进程数为零则认为异常
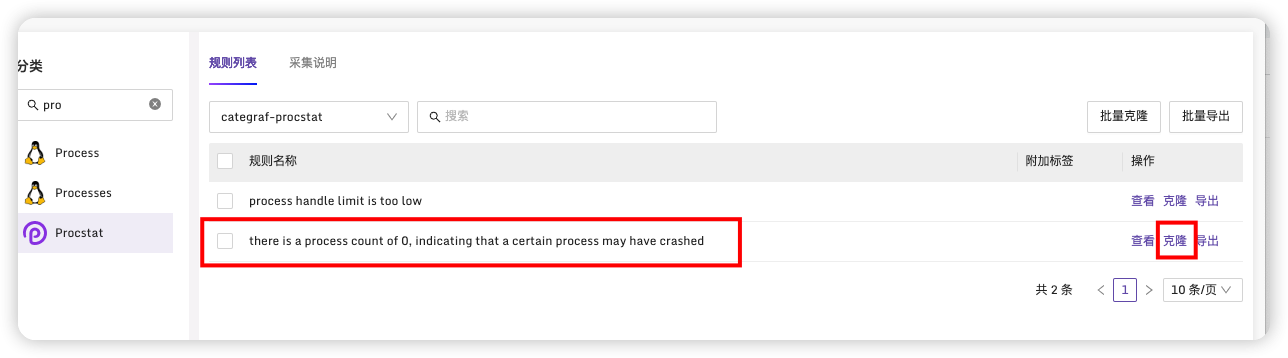
导入到指定业务组
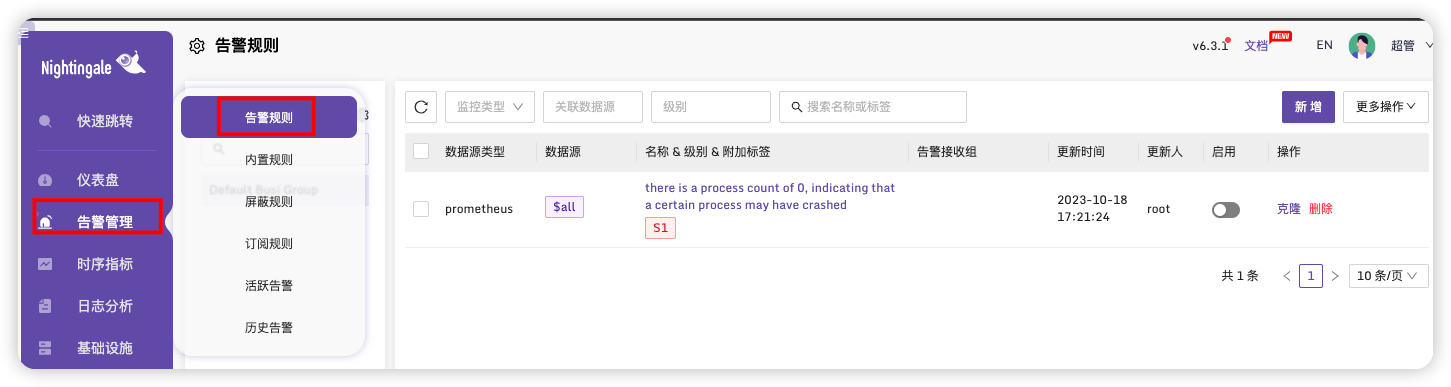
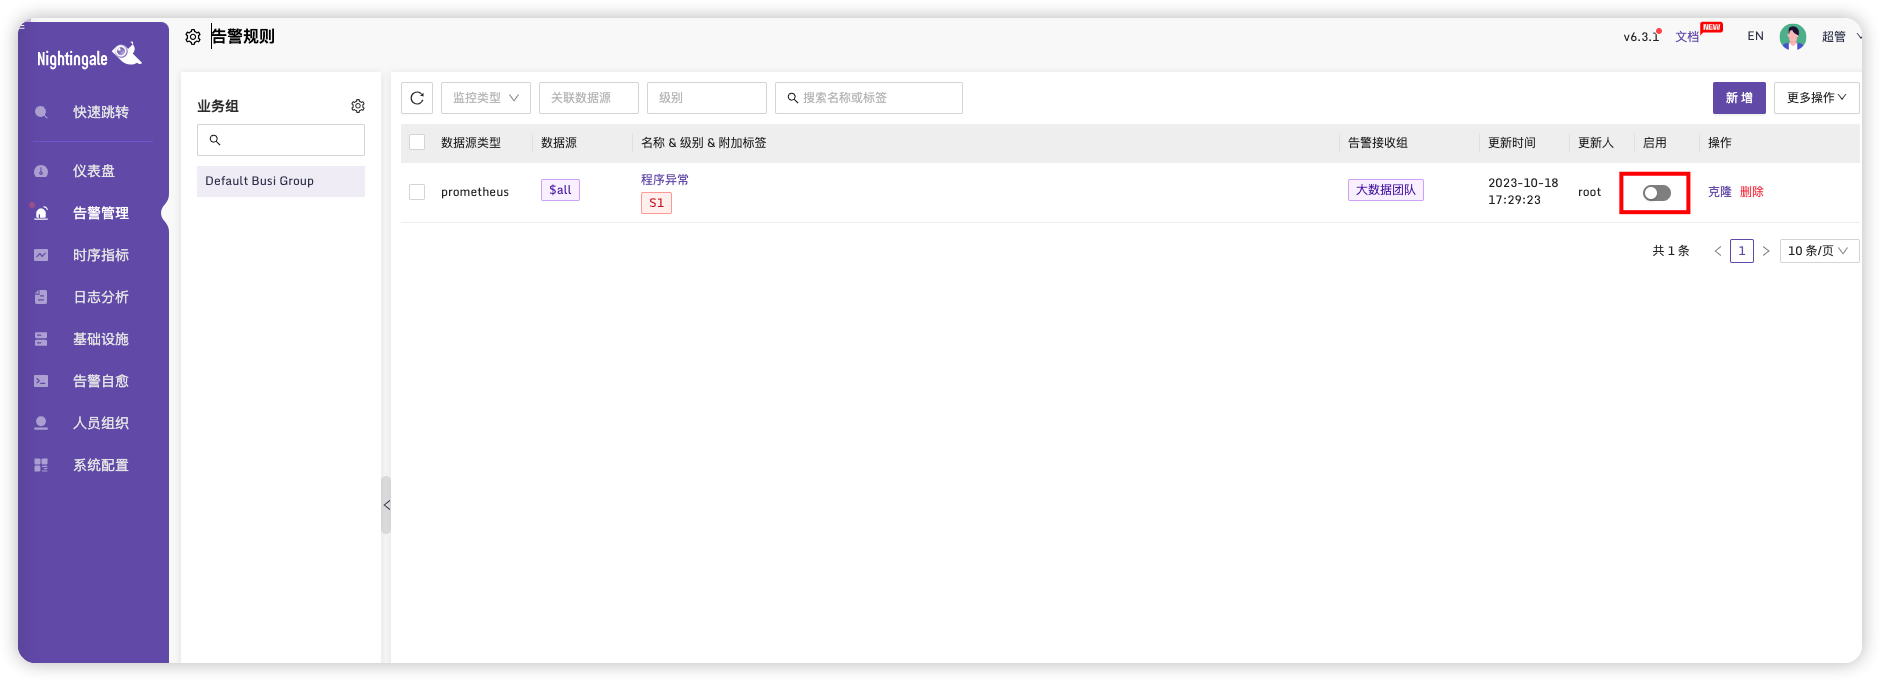
选择告警管理->告警规则可以看到我们克隆的预警规则
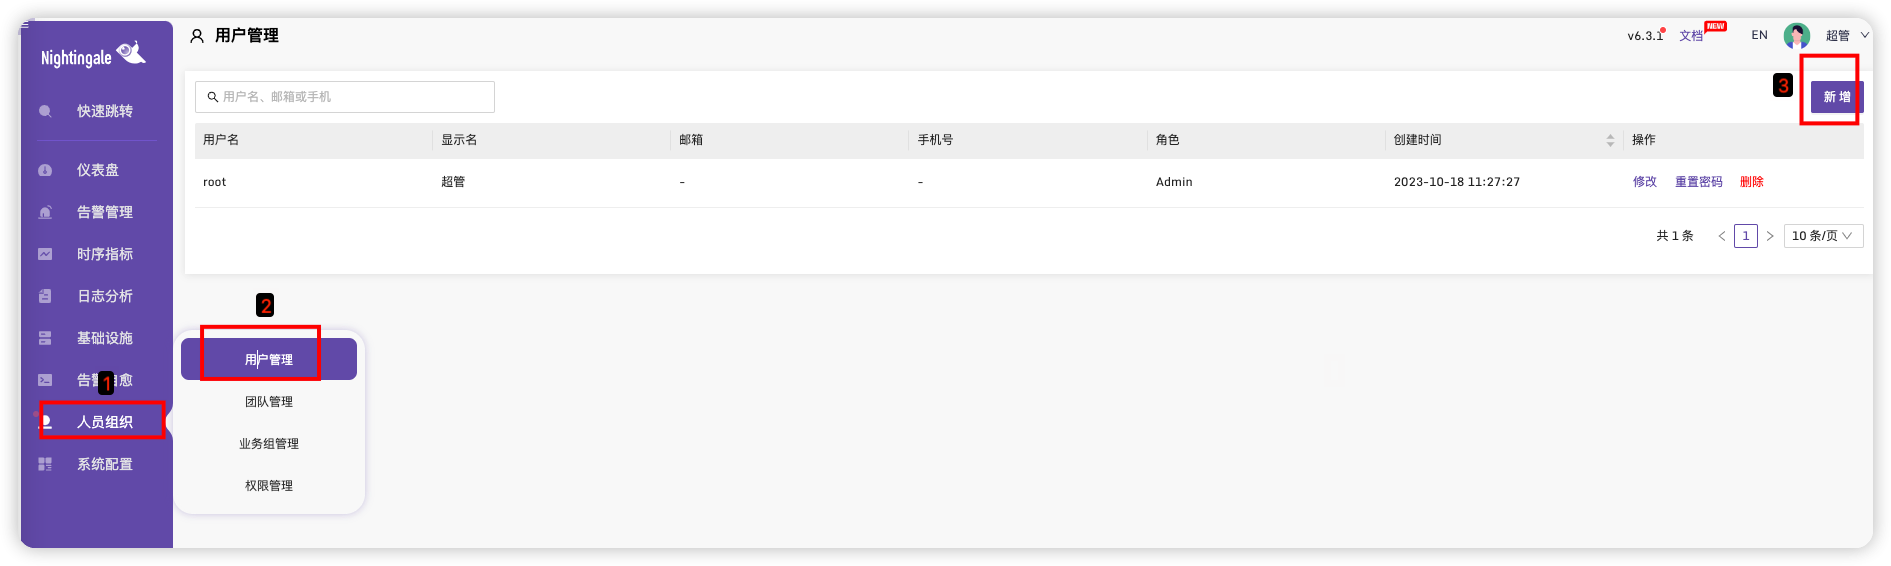
这里我们先设置一下人员组织,设置接收预警的人员
设置用户
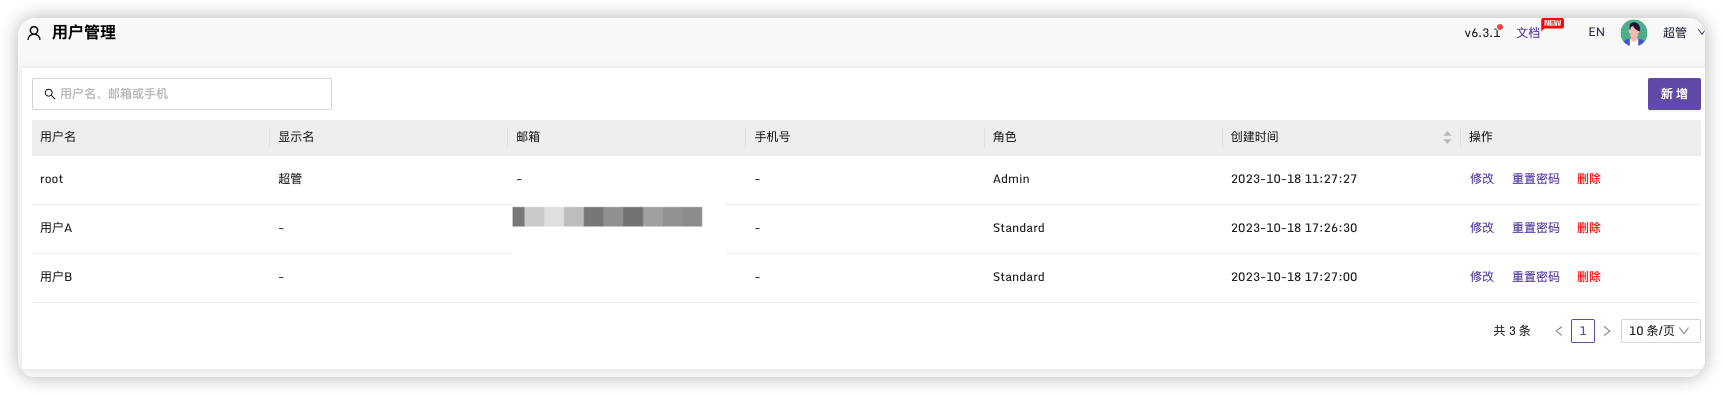
添加两个用户,并设置邮箱
设置团队
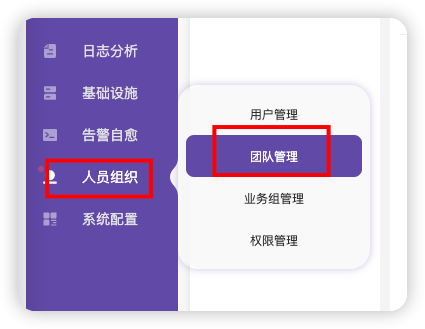
点击新增、输入名称
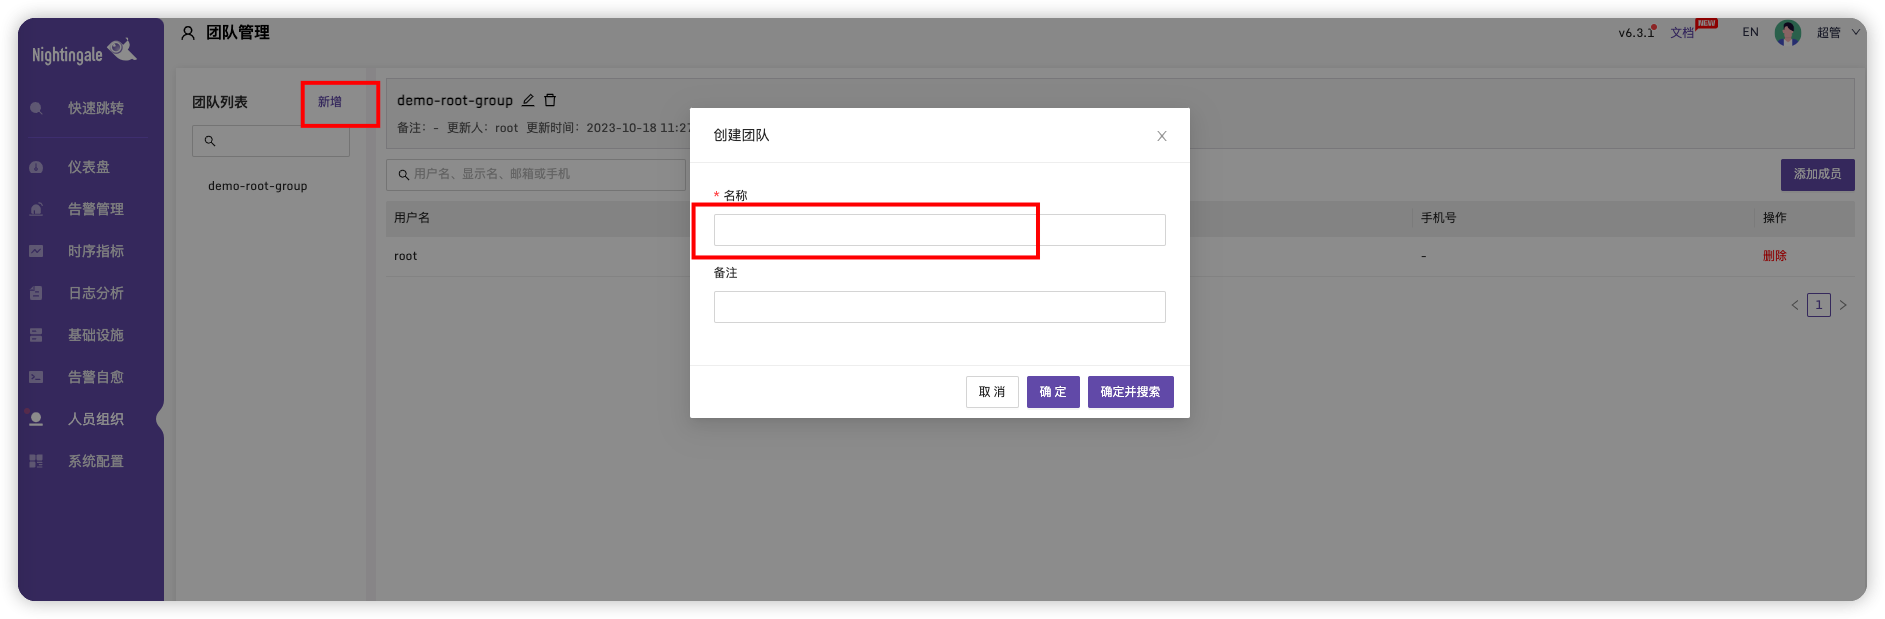
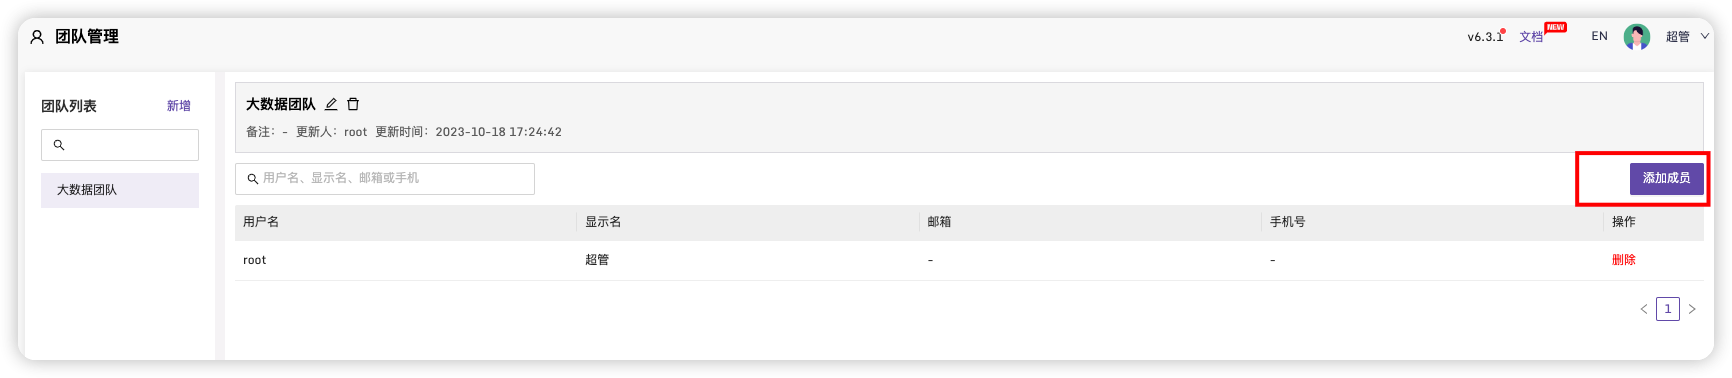
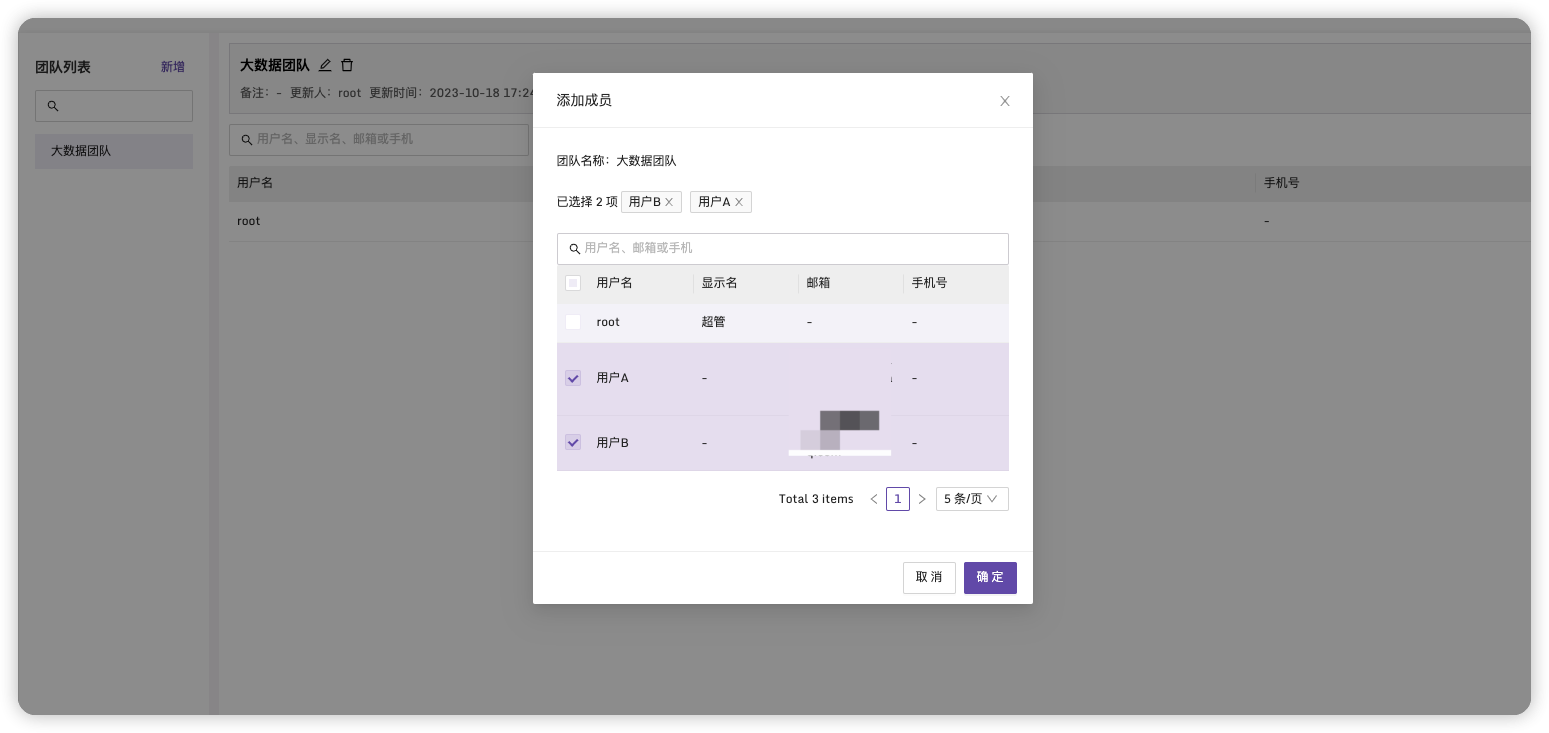
新增成员
回到告警管理->告警规则,点击名称进入规则
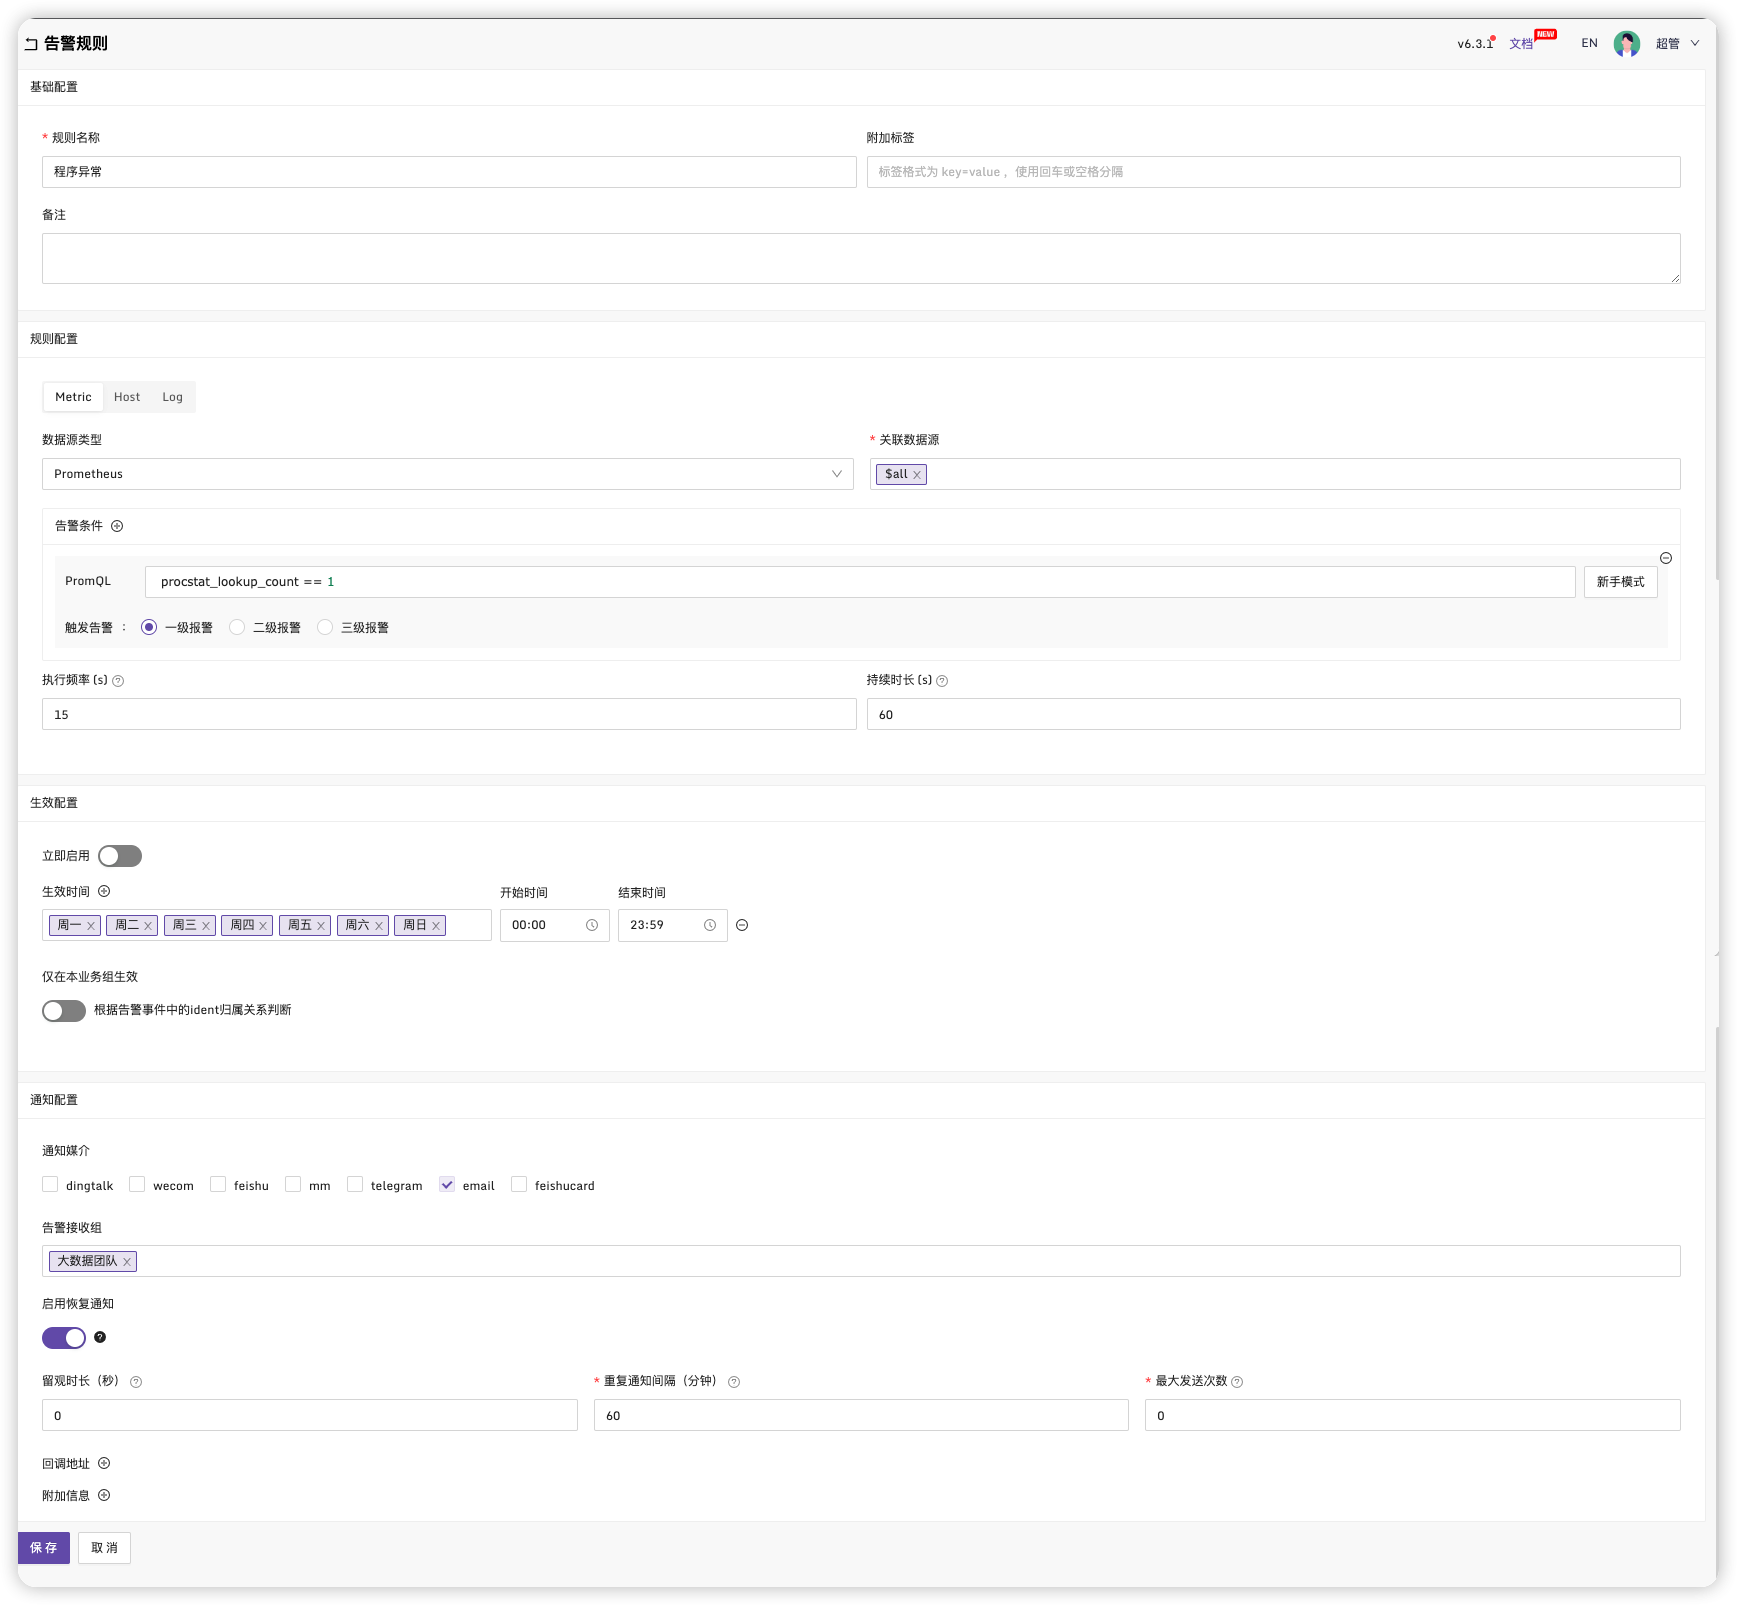
保存,点击启用
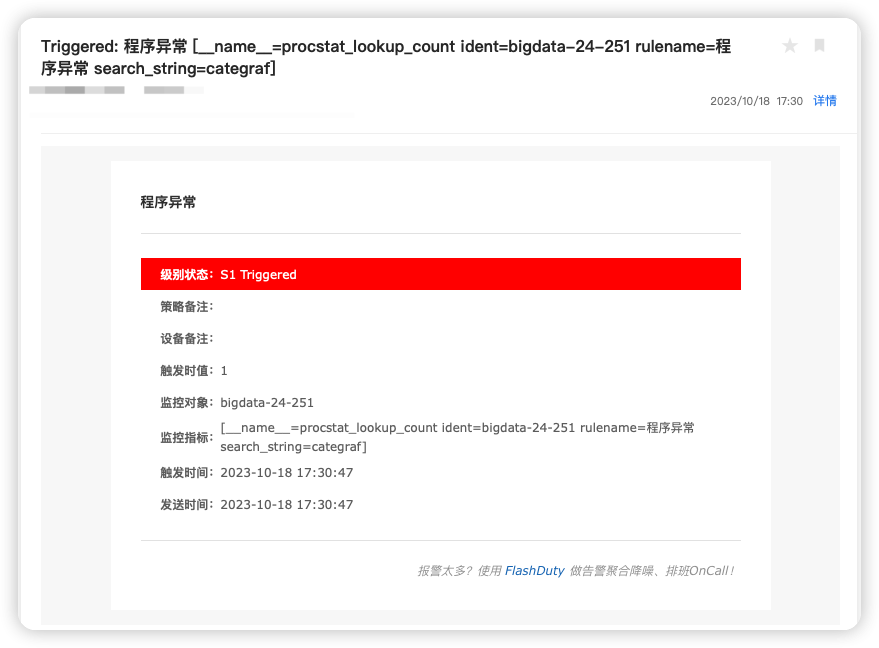
上面我设置监控预警规则为进程数为1 时进行预警,为了测试效果,生产改为0。
过一会在邮件中可以看到预警邮件
# 配置指定机器
上面的预警配置,默认会应用的所有机器,下面介绍如何监控指定的机器进行预警。
# 给机器配置标签
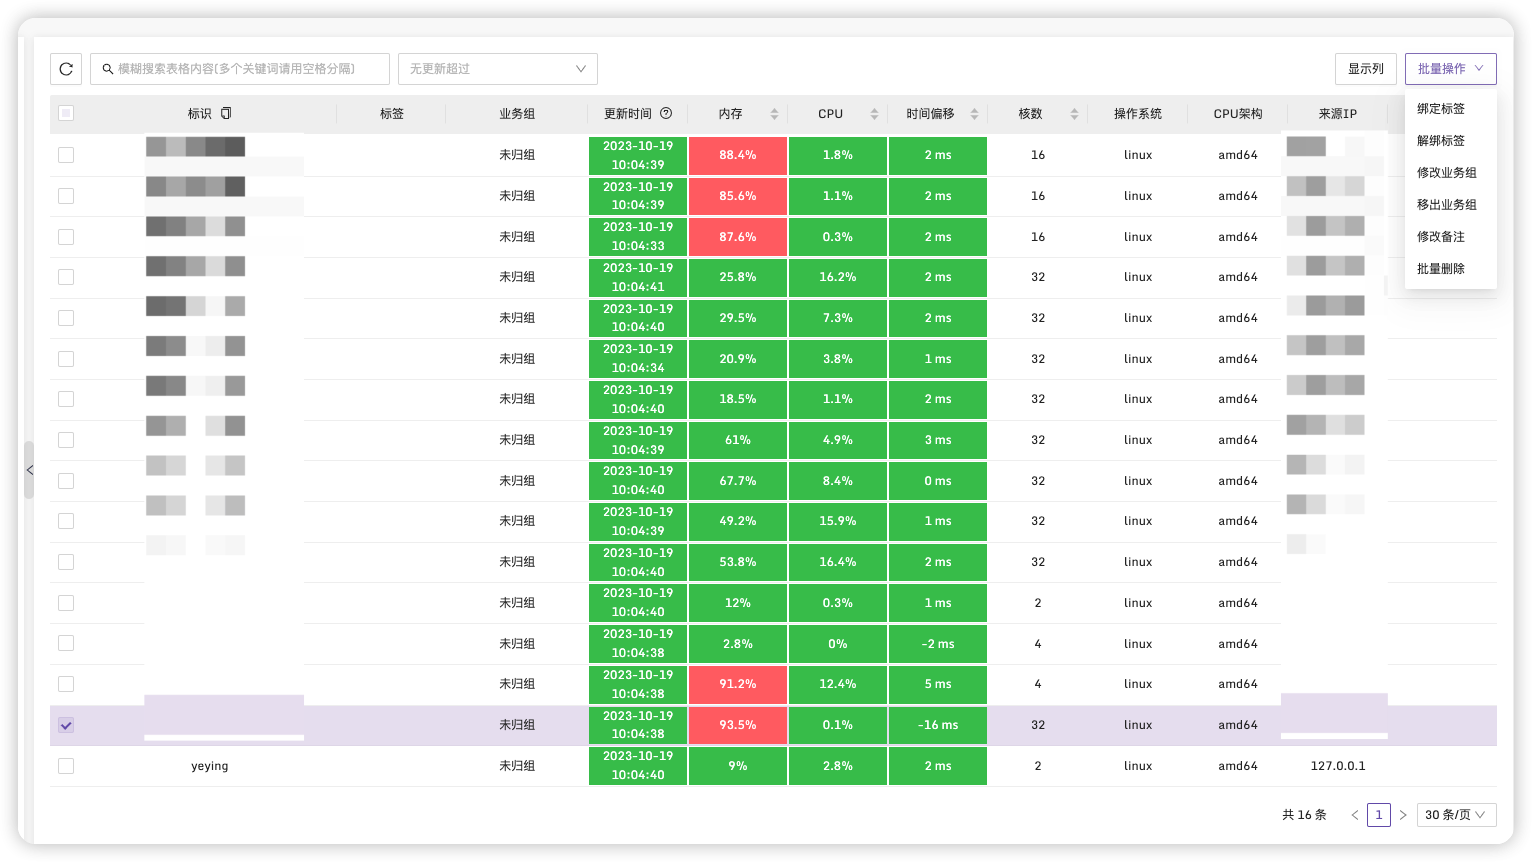
选择基础设置->机器列表
勾选我们需要设置标签的服务器,点击右上角批量操作->绑定标签
输入需要设置的标签名,标签格式需要为key=value这样,key要是使用数字字母开头
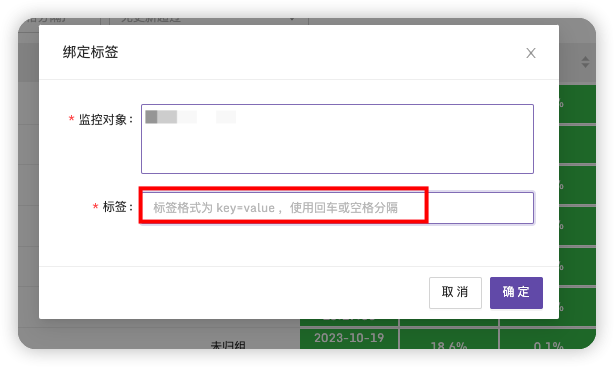
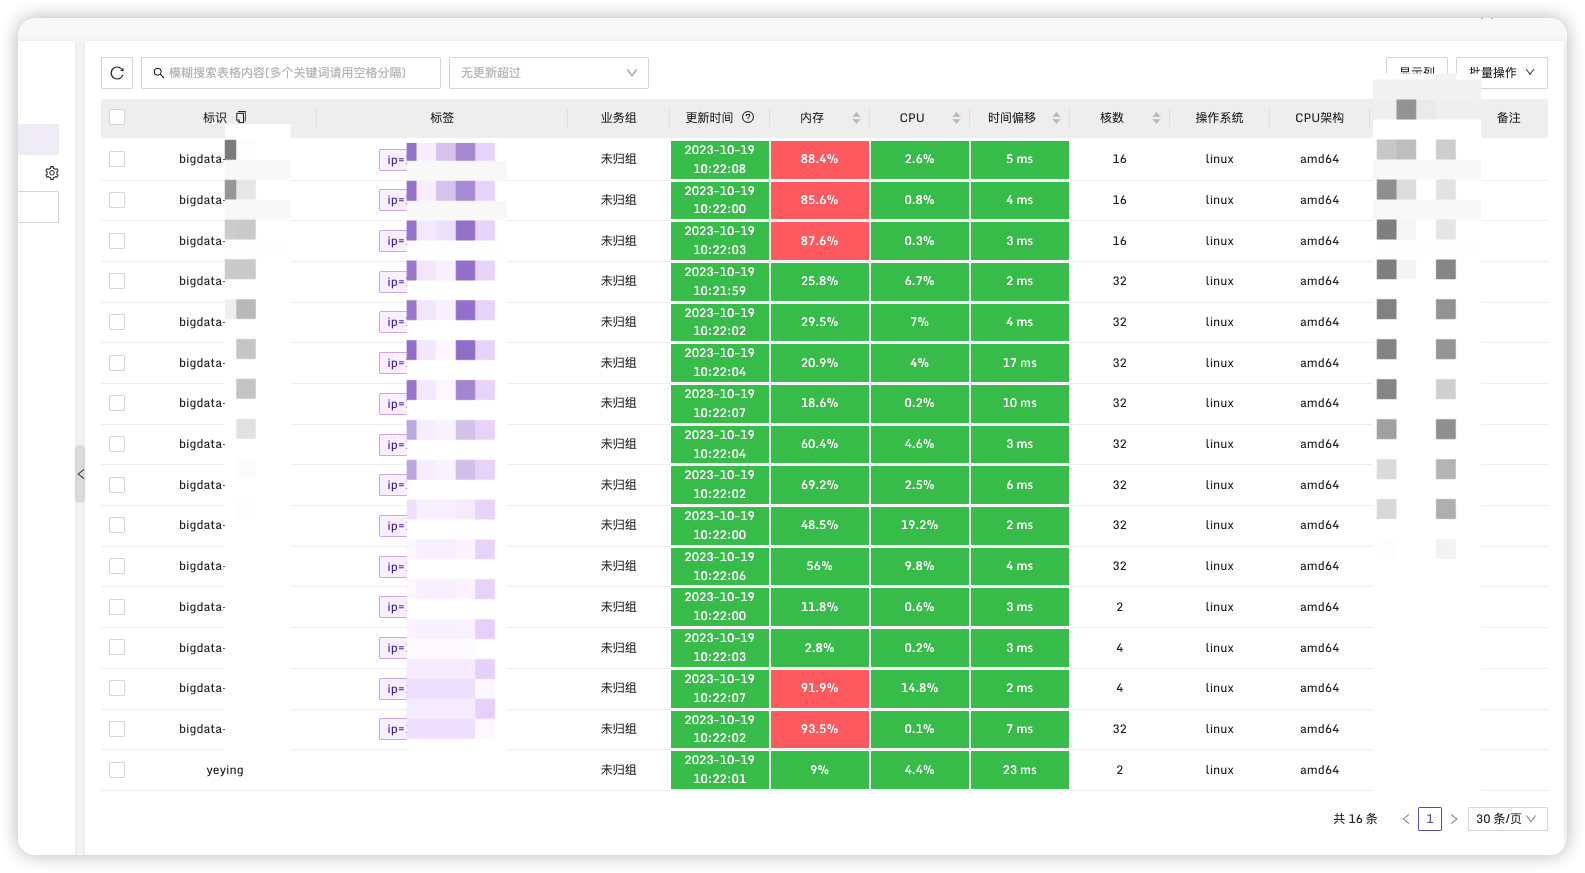
这里我设置成ip=xxxx,每台机器都添加一个,方便后面设置区分。我们也可以根据服务器部署服务类型来这是其他的标签如type=开发环境Hadoop集群。
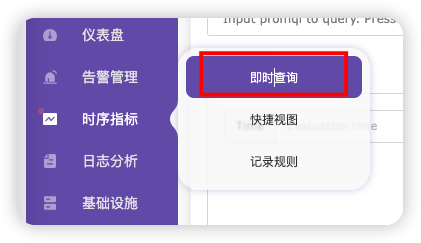
在时序指标->即时查询,搜索我们需要预警的指标
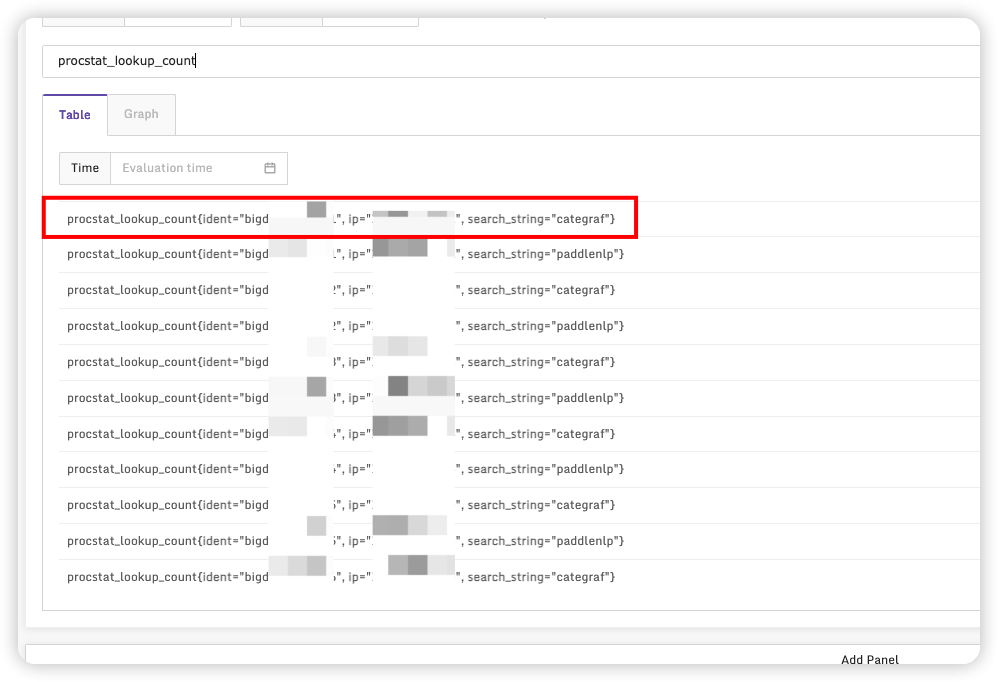
可以看到指标下有具体的参数。
在告警规则中配置告警条件,选择我们刚刚配置的标签
procstat_lookup_count{ip="xxx",search_string="paddlenlp"} == 0 or procstat_lookup_count{ip="xxx",search_string="paddlenlp"} == 0 or procstat_lookup_count{ip="xxx",search_string="paddlenlp"} == 0
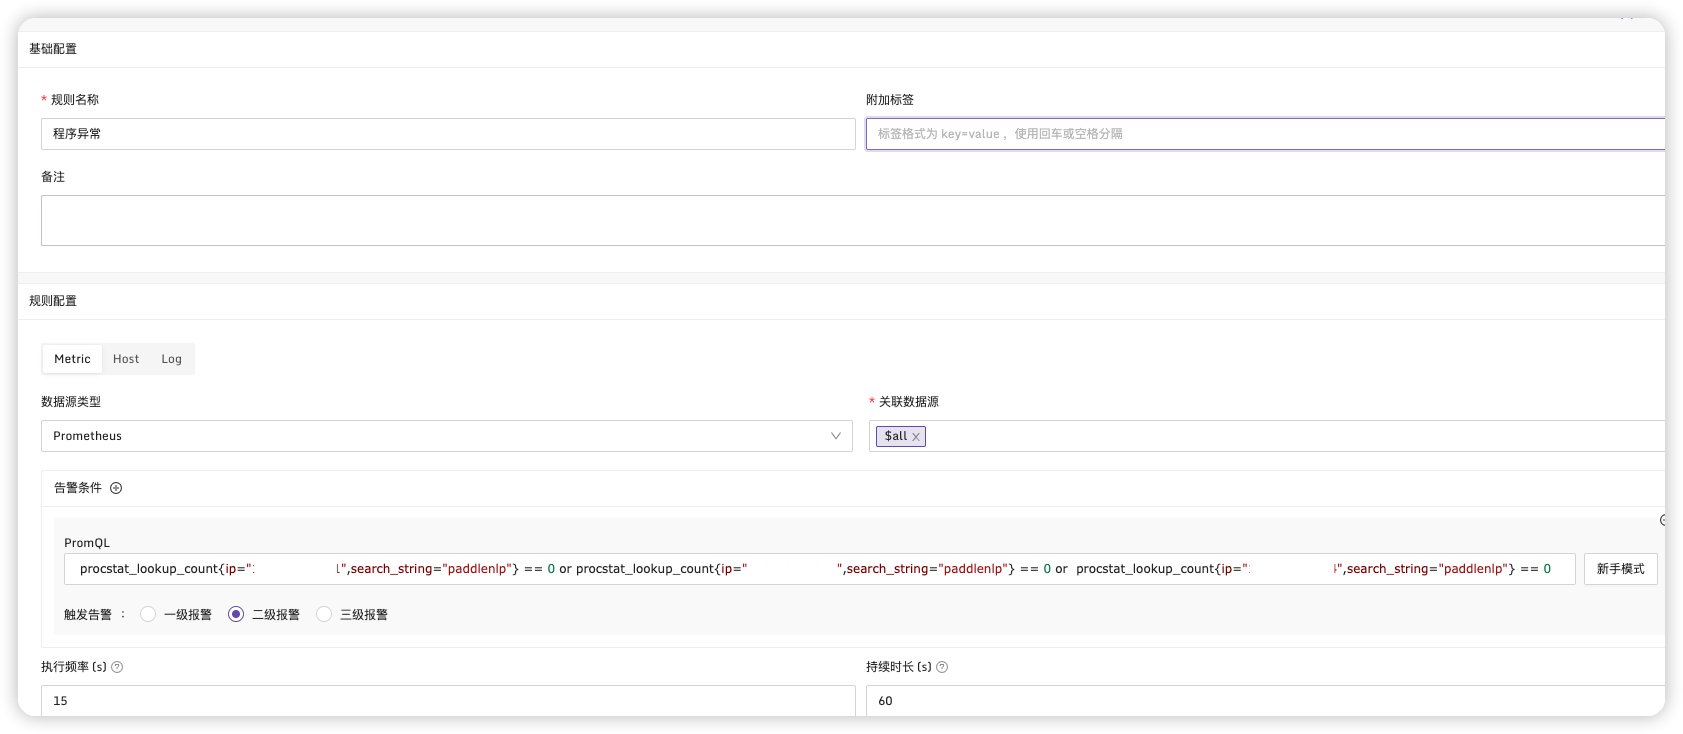
保存,这时预警就会根据设置的具体条件进行预警。
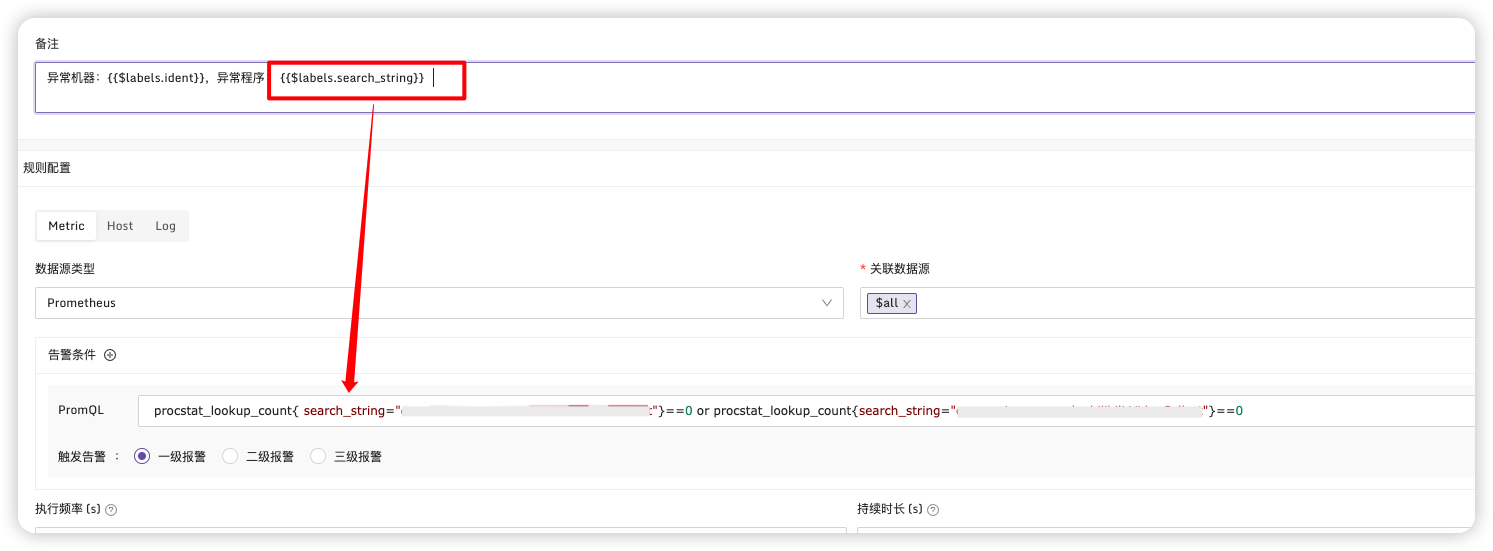
# 多台机器告警时显示异常机器
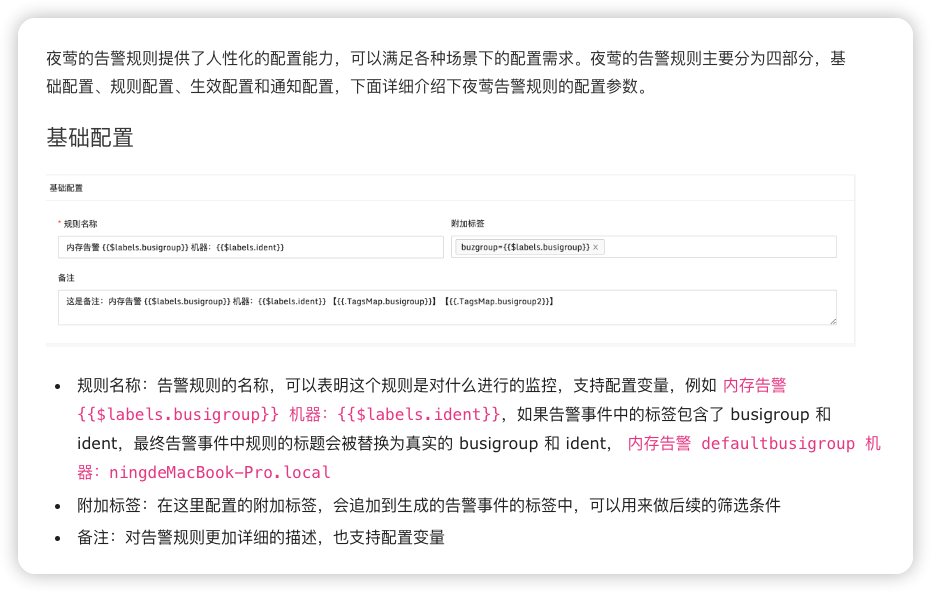
配置样例:
# 常用命令总结
# 以服务方式启动
systemctl start categraf
# 停止服务
systemctl stop categraf
# 重启服务
systemctl restart categraf
# 查看状态
systemctl status categraf
2
3
4
5
6
7
8